Disrupting the Borg is expensive and time consuming!
Google Search
-
Recent Posts
- Gaslighting 1924
- “Why Do You Resist?”
- Climate Attribution Model
- Fact Checking NASA
- Fact Checking Grok
- Fact Checking The New York Times
- New Visitech Features
- Ice-Free Arctic By 2014
- Debt-Free US Treasury Forecast
- Analyzing Big City Crime (Part 2)
- Analyzing Big City Crime
- UK Migration Caused By Global Warming
- Climate Attribution In Greece
- “Brown: ’50 days to save world'”
- The Catastrophic Influence of Bovine Methane Emissions on Extraterrestrial Climate Patterns
- Posting On X
- Seventeen Years Of Fun
- The Importance Of Good Tools
- Temperature Shifts At Blue Hill, MA
- CO2²
- Time Of Observation Bias
- Climate Scamming For Profit
- Climate Scamming For Profit
- Back To The Future
- “records going back to 1961”
Recent Comments
- John Francis on “Why Do You Resist?”
- conrad ziefle on Gaslighting 1924
- Bob G on Gaslighting 1924
- Bob G on Gaslighting 1924
- Bob G on Gaslighting 1924
- conrad ziefle on Gaslighting 1924
- Bob G on Gaslighting 1924
- Bob G on Gaslighting 1924
- arn on Gaslighting 1924
- conrad ziefle on Gaslighting 1924
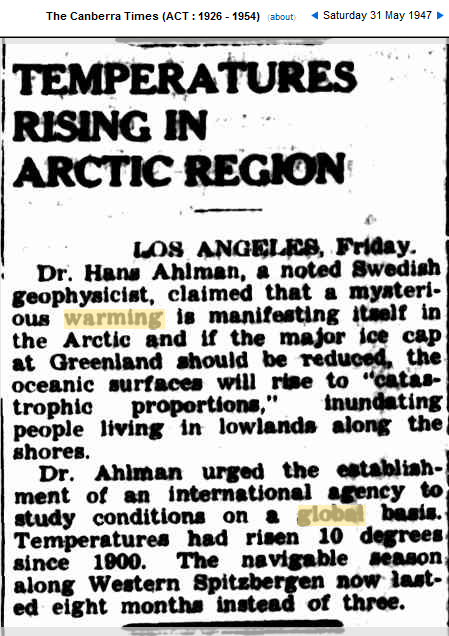
Arctic Warmed 10 Degrees Between 1900 And 1947
This entry was posted in Uncategorized. Bookmark the permalink.


“A paper published last month in the journal Climate Dynamics finds that “The Antarctic sea ice extent (SIE) shows an increased trend during 1979–2009, with a trend rate of 1.36 ± 0.43% per decade. Ensemble empirical mode decomposition analysis shows that the rate of the increased trend has been accelerating in the past decade.”
http://hockeyschtick.blogspot.com/2011/08/antarctica-sea-ice-shows-accelerating.html
couldn’t have happened….it was before 1950…
Nope. More like 5.6F from c1902 to c 1943.
This is what real science as opposed to newspaper clippings has to say:
http://forces.si.edu/arctic/pdf/ACT%203_ARCTIC%20HEAT%20WAVE.pdf
Please notice the Global Temperatures for the same period.
Which satellite are you using?
Correction on the above.
“More like 5.6F from c1902 to c 1943.”
The above implies a trend but there is no trend; only a comparison between 2 years. Therefore, my statement above should be corrected to:
“More like 5.6F when the year c1902 is compared to c1943”
For an actual trend between 1900 and 1940; as well as 1900 through the present, see the link below.
http://woodfortrees.org/plot/hadcrut3vgl/mean:1/plot/hadcrut3vgl/trend/plot/hadcrut3vgl/from:1900/to:1940/trend/plot/hadcrut3vgl/from:1900/to:2011/trend
That WFT link is a global trend. Up to this point the focus of this post has been on Arctic temps.
It’s a shame that some people just can’t seem to grasp the difference between the Arctic and the entire globe. Why it seems like only last week we were being lectured that North America isn’t the globe when it turned out that the weather patterns in North America weren’t going through any unusual disruption. You would almost think it was an elaborate joke if it turned out that the same person also couldn’t distinguish fiction from non-fiction.
J Calvert; I forgot to add this:
http://www.arcus.org/arcss/sass/sass1projects/downloads/4_Rigor_03.06.ppt#282,4,Slide 4
http://www.lanceandeskimo.com/paul/skeletor.ppt