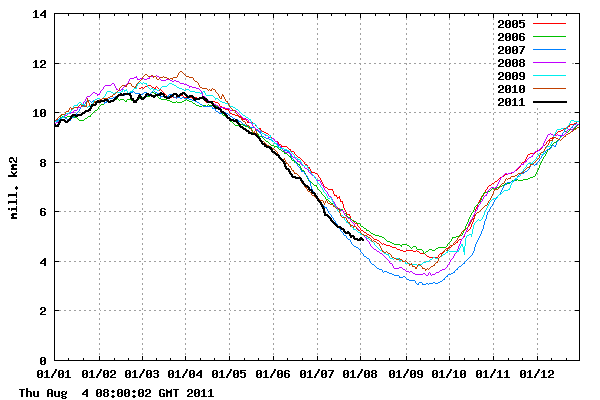
It looks to me like DMI will have another flat to up slightly down day tomorrow, bringing it almost even with 2008, 2009 and 2010. (There was ice loss seen in the Canadian Archipelago which I missed the first time around.)
Disrupting the Borg is expensive and time consuming!
Google Search
-
Recent Posts
- Gaslighting 1924
- “Why Do You Resist?”
- Climate Attribution Model
- Fact Checking NASA
- Fact Checking Grok
- Fact Checking The New York Times
- New Visitech Features
- Ice-Free Arctic By 2014
- Debt-Free US Treasury Forecast
- Analyzing Big City Crime (Part 2)
- Analyzing Big City Crime
- UK Migration Caused By Global Warming
- Climate Attribution In Greece
- “Brown: ’50 days to save world'”
- The Catastrophic Influence of Bovine Methane Emissions on Extraterrestrial Climate Patterns
- Posting On X
- Seventeen Years Of Fun
- The Importance Of Good Tools
- Temperature Shifts At Blue Hill, MA
- CO2²
- Time Of Observation Bias
- Climate Scamming For Profit
- Climate Scamming For Profit
- Back To The Future
- “records going back to 1961”
Recent Comments
- John Francis on “Why Do You Resist?”
- conrad ziefle on Gaslighting 1924
- Bob G on Gaslighting 1924
- Bob G on Gaslighting 1924
- Bob G on Gaslighting 1924
- conrad ziefle on Gaslighting 1924
- Bob G on Gaslighting 1924
- Bob G on Gaslighting 1924
- arn on Gaslighting 1924
- conrad ziefle on Gaslighting 1924


The HORROR!
It would be nice for the various measures of sea ice to agree at least broadly.
The Cryosphere data published here http://arctic.atmos.uiuc.edu/cryosphere/IMAGES/seaice.recent.arctic.png show the gap between the current ice level and the 30 year average at near record levels, at almost 1.8mm km**2. Afaik, the differences arise out of differing ice coverage percentages and different time periods for the averages. Still, the differences in the recent trends is quite striking.
JAXA finally posted a bigger loss day…preliminary number shows a loss of 81094 km^2. Average loss is 81524 km^2, so it’ll be a nailbiter for the final number to see if it managed 18 days straight with below-average loss.
-Scott
any idea what the next few weeks hold Steve? in other words, what is the weather shaping up to look like in terms of what affects ice loss? i seem to remember a strongly negative AO can blow ice out of the strait, but i suspect a strongly positive AO has negative sides too….do we sort of hope for a moderate AO?
I think the next ten days will be slow. After that I have no idea.
A strongly positive AO has negative sides? What does that mean? It seems a contradiction
A positive AO has a stronger polar vortex which can blow ice about more, a more negative can lead to calmer vortex but warm southerly winds from Russia that cause in situe melt.
Andy
I think Robert means a positive AO will have negative effects on ice loss!!
think of the seals!!!
See ice extent loss on JAXA went up to 80 000 today from a run of low values for the last few days.
Will have to see what happens in the rest of August.
It is diving…
And the reason can be found here:
http://www.iup.uni-bremen.de:8084/amsr/arctic_AMSRE_nic.png
There are lot of thin ice in Beaufort, Chukchi and East Siberian Seas. Huge lost of ice can be expected there in the comming days. I’ll bet for a new record minimum on september.
Nonsense. There was in an increase in extent the western Arctic. The small dip was due to lower extent in the Eastern Arctic and Canadian Archipelago.
Eh, where are you getting your data from? DMI uses the ice concentration data from OSISAF, available here:
http://osisaf.met.no/p/ice/nh/conc/conc.shtml
Today’s sharp drop is very clearly driven by melt in the northern Beaufort, Chukchi and Laptev seas. Just compare the latest two images, here:
http://osisaf.met.no/p/ice/nh/conc/imgs/OSI_HL_SAF_201108031200_pal.jpg
http://osisaf.met.no/p/ice/nh/conc/imgs/OSI_HL_SAF_201108041200_pal.jpg
I’ve given some links to the data DMI uses for their graph: can you unclog it from the moderation queue?
JAXA maps.
Radical suggestion: why not use JAXA maps when looking at JAXA graphs, and DMI maps when looking at DMI curves? I’ve now had to query you both ways round on this – make up your flipping mind already!
Hmm.. Different Arctic?
No, different sensors. JAXA use AMSR-E, DMI use SSM/I. They have different sensitivities to thin ice, as well as the different thresholds in use for the two curves.
same Arctic
Paul H says:
August 5, 2011 at 11:18 am
I think Robert means a positive AO will have negative effects on ice loss!!
Now when you say negative do you mean no effect or make it worse ?
Or even better.. depending on which side of the fence you are looking at 😀
You can tell it is Friday. I’m even being kind to Steve,
Andy
It depends whether you regard less ice as being good or bad!
Yesterday my daughter invited herself round for a BBQ on Sunday as the weather was so nice. I did not have the heart to tell her it was going to be cold and rainy by Sunday.