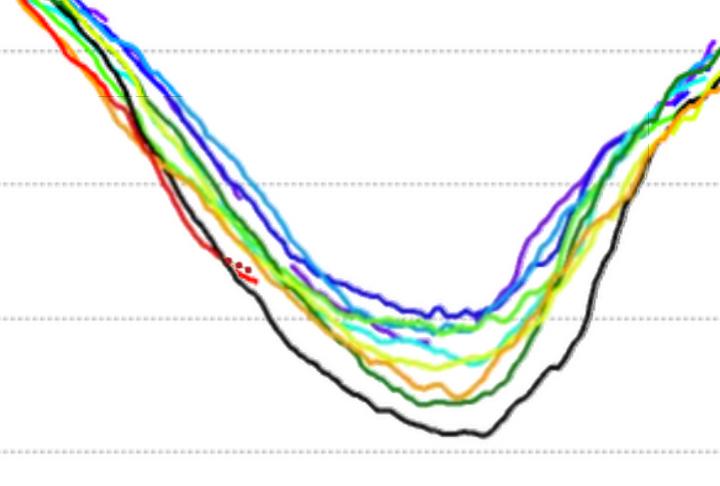
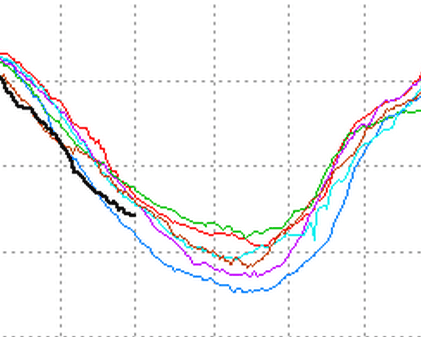
A week ago I made a forecast for JAXA through August 1 (dotted line.) As you can see, my forecast was a little high. My system probably does a better job of measuring 30% ice than 15% ice, so my forecast matches closer with DMI than JAXA.
Disrupting the Borg is expensive and time consuming!
Google Search
-
Recent Posts
- Gaslighting 1924
- “Why Do You Resist?”
- Climate Attribution Model
- Fact Checking NASA
- Fact Checking Grok
- Fact Checking The New York Times
- New Visitech Features
- Ice-Free Arctic By 2014
- Debt-Free US Treasury Forecast
- Analyzing Big City Crime (Part 2)
- Analyzing Big City Crime
- UK Migration Caused By Global Warming
- Climate Attribution In Greece
- “Brown: ’50 days to save world'”
- The Catastrophic Influence of Bovine Methane Emissions on Extraterrestrial Climate Patterns
- Posting On X
- Seventeen Years Of Fun
- The Importance Of Good Tools
- Temperature Shifts At Blue Hill, MA
- CO2²
- Time Of Observation Bias
- Climate Scamming For Profit
- Climate Scamming For Profit
- Back To The Future
- “records going back to 1961”
Recent Comments
- John Francis on “Why Do You Resist?”
- conrad ziefle on Gaslighting 1924
- Bob G on Gaslighting 1924
- Bob G on Gaslighting 1924
- Bob G on Gaslighting 1924
- conrad ziefle on Gaslighting 1924
- Bob G on Gaslighting 1924
- Bob G on Gaslighting 1924
- arn on Gaslighting 1924
- conrad ziefle on Gaslighting 1924


The Goracle surely expected a record melt to leverage his dog and pony show in Sept. Now, he will probably be harping on “record lows” from winter or spring. Oh, the Hu-mani-tee!
Steven:
Are you sure you wanted to say “April First” and not August First? April is still a bit away and you can not yet verify a prediction for that date. 😉
Steven:
That reads better!
You got a system? Does it work for the horses?
Either way, this ice-melting season is more of a dirth-spiral, with almost nothing happening.
Won’t somebody think of the Serreze?
The Aug 1 number is still a preliminary number. After the final number is posted, it will likely be higher…the last couple day’s changes have been on the order of 20k km^2 increases.
-Scott
For those of us still new to the sea ice follies, could someone provide (or reference) a quick and dirty description/comparison of the different sea ice graphs and why they occasionally differ?
Much appreciated.
MJB –
I suggest starting here: http://wattsupwiththat.com/reference-pages/sea-ice-page/
I would give a few of the basics, but my kiddo needs a diaper change!
-Scott
Have you seen the Nansen Arctic ROOS (NORSEX) Sea Ice Extent? The 2011 plot has “jumped the gap” and is equal to 2010. It exceeds the 2007 plot by about 500,000 sq km.
Not quite equal to 2010 yet…still 1 day behind or so. If it loses ~0 today, then it’ll be equal. Look at the full-size version here.
Regardless, a fairly large improvement in extent…goes to show the importance of weather. Also, Nansen shows the area much more favorably than other metrics…I wonder if they have better rejection of surface melt pond interference?
-Scott
Scott, does your spread sheet contain temp data along with the daily ice loss?
Hi James,
No, it doesn’t…only basic stats from ice numbers only. Definitely something that I considered adding in the past. SSTs would be particularly valuable. Also, I need to add in the Nansen ROOS data…although I think it’s only available with monthly resolution. Maybe I could write a script to convert the plots to numerical data to get higher resolution…
-Scott
Did sea ice minimum come early this year? 🙂