Dr. James Hansen at NASA proposes 350 ppm as a safe level to stabilize the climate, halt sea level rise, stop glacial melt, and make the weather like it used to be in the good old days. Others have suggested that we have to cut CO2 back to 300 ppm.
There is no need to speculate about what would happen at 300 ppm, as we have plenty of historical records from the 19th century – when CO2 was below 300 ppm.
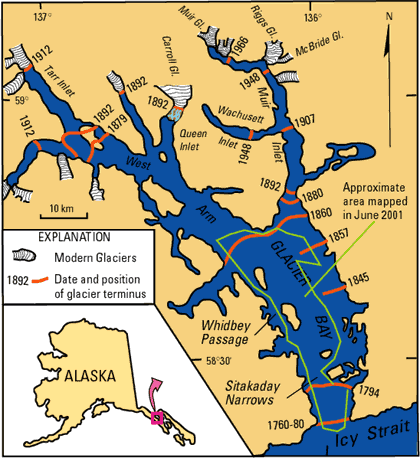
The glacier at Glacier Bay, Alaska retreated an incredible eight feet per day during the 19th century. It is quite clear that dropping CO2 below 300 ppm will not stop glaciers from retreating.
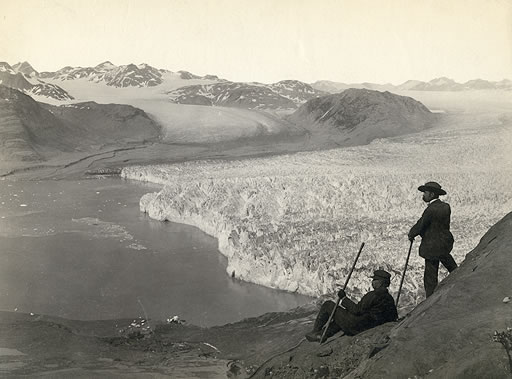
http://soundwaves.usgs.gov/2001/07/glacierbaymap.gif
Now let’s focus on a small sampling of some of the more notable weather events during the years 1886 – 1894.
1886 was the most active hurricane season in US history. Seven hurricanes made landfall, including two major hurricanes.
Highest Saffir-		Central		Max.   	Name
		and Category by 	Simpson U.S.		Pressure	Winds
		States			 Category

1886	Jun	TX, N2; LA, 2			2		973		85	-----
1886	Jun	FL, NW2; I-GA, 1		2		973		85	-----
1886	Jun	FL, NW2; I-GA, 1		2		973		85	-----
1886	Jul	FL, NW1				1		985		70	-----
1886	Aug	TX, C4				4		925		135	"Indianola"
1886	Sep   #	TX, S1, C1			1		973		80	-----
1886	Oct	LA, 3; TX, N2			3		955		105	-----
http://www.aoml.noaa.gov/hrd/hurdat/ushurrlist18512009.txt
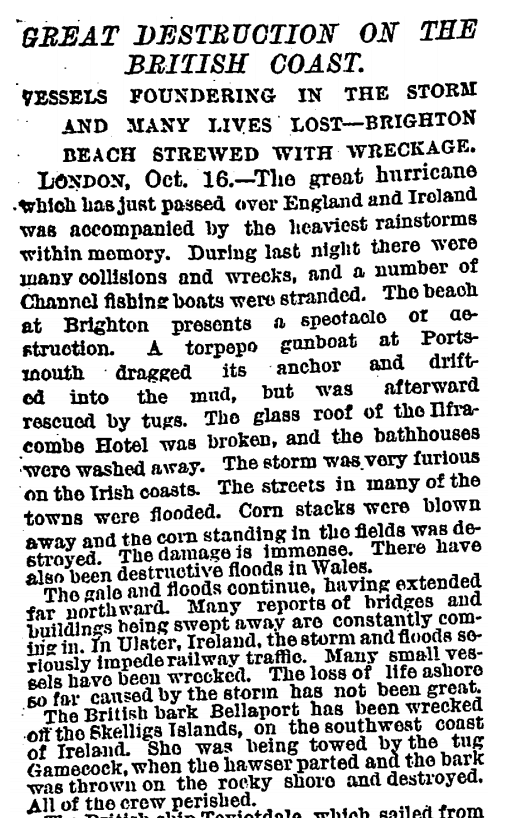
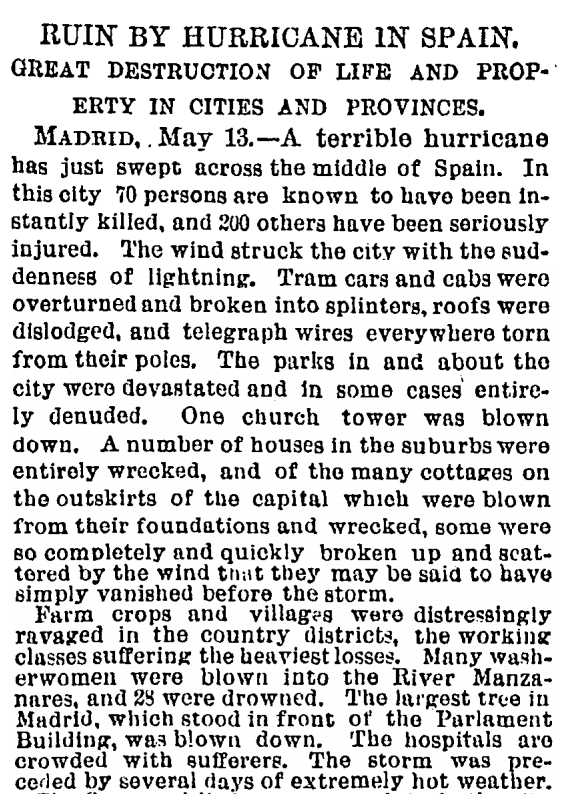
Terribly destructive storms also struck Europe that year.

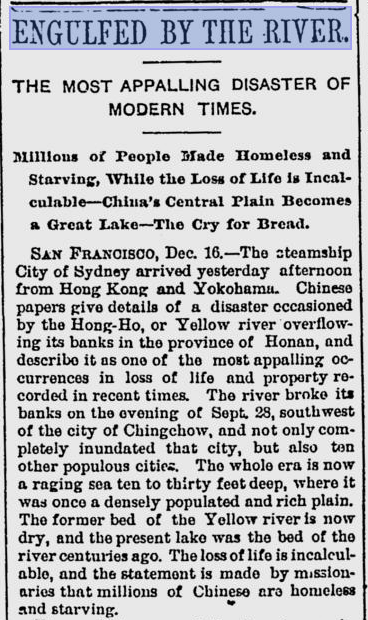
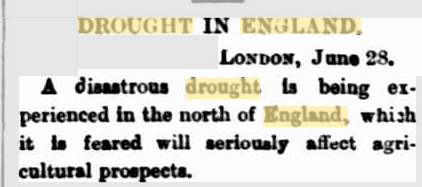
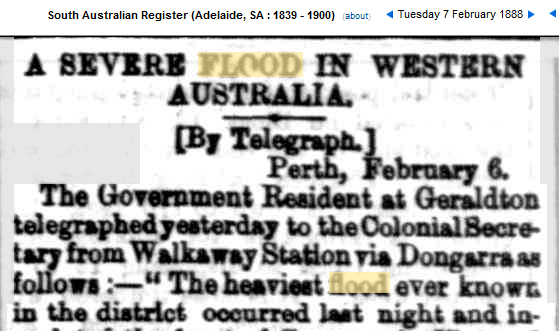
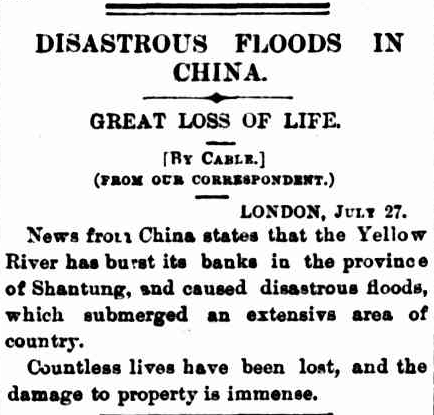
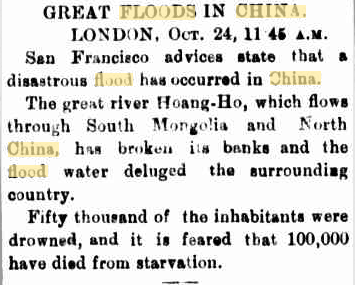
1887 was a year of terrible floods and droughts – nearly a million people drowned in China, and Australia suffered one their worst floods on record – while England suffered an extreme drought.
http://news.google.com/newspapers
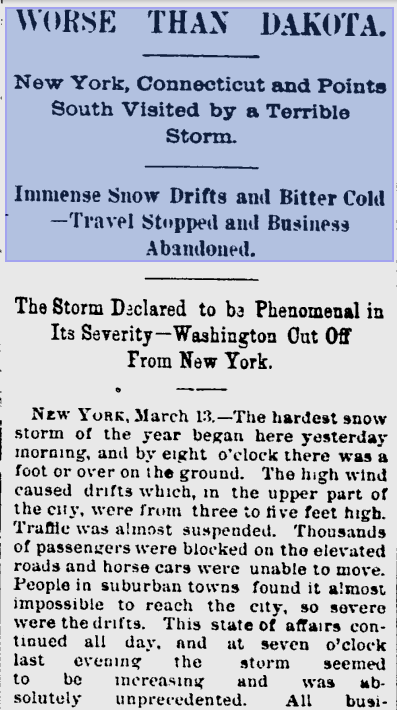
1888 saw more severe floods in China, Chile and Australia, and a massive snowstorm on the east coast of the US.
http://news.google.com/newspapers
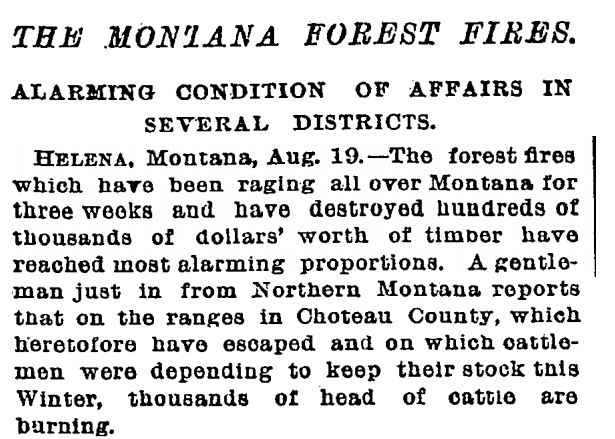
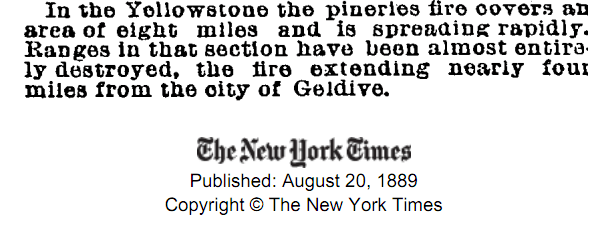
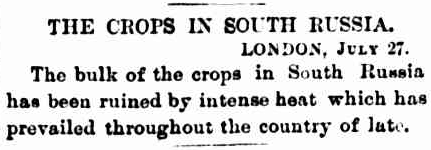
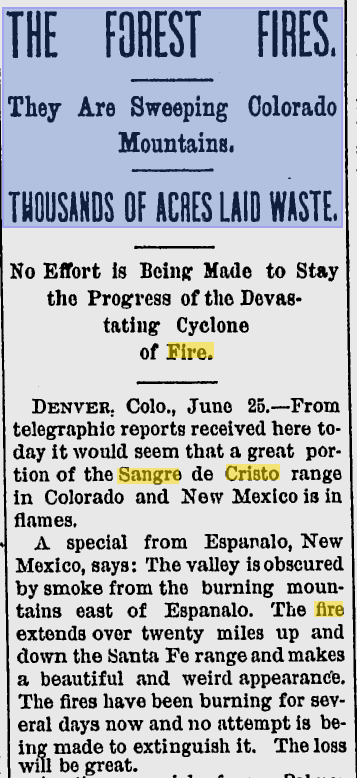
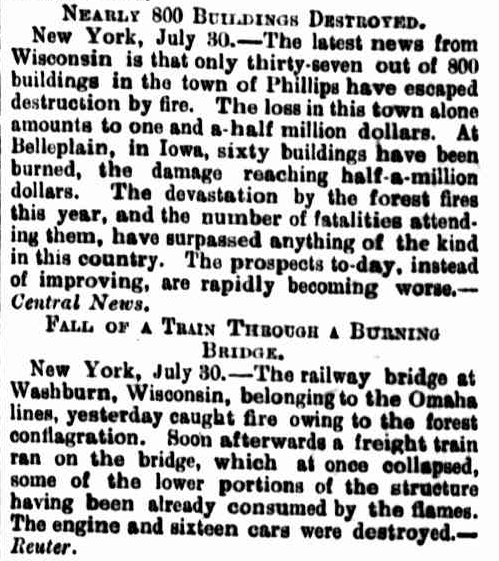
1889 saw more catastrophic flooding in China, terrible forest fires in the US, and a disastrous drought in Russia.
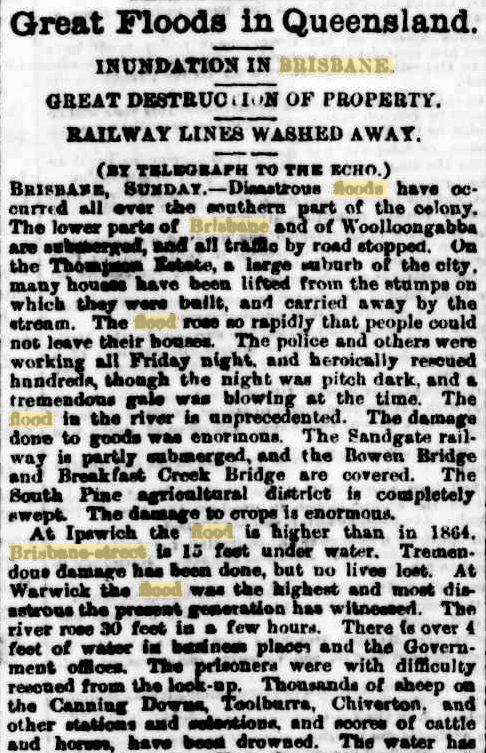
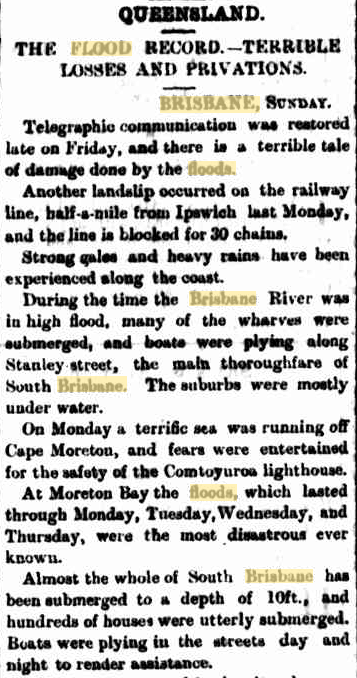
1890 saw Brisbane under 10 feet of flood water and massive forest fires in the Rocky Mountains

http://news.google.com/newspapers
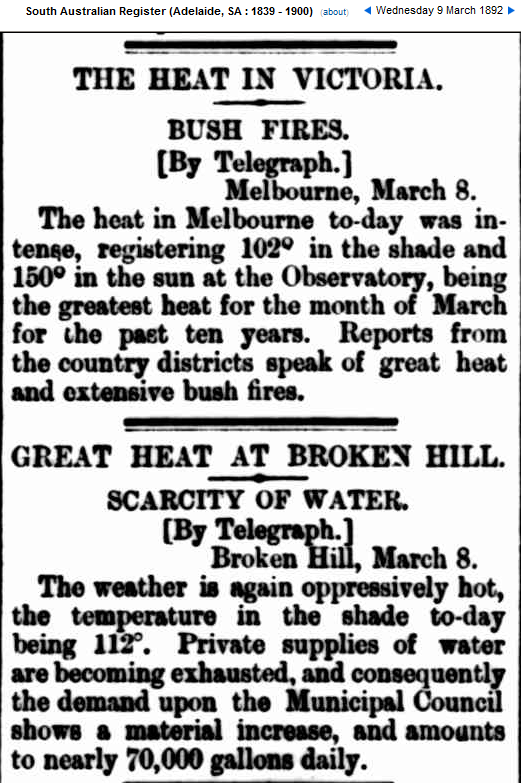
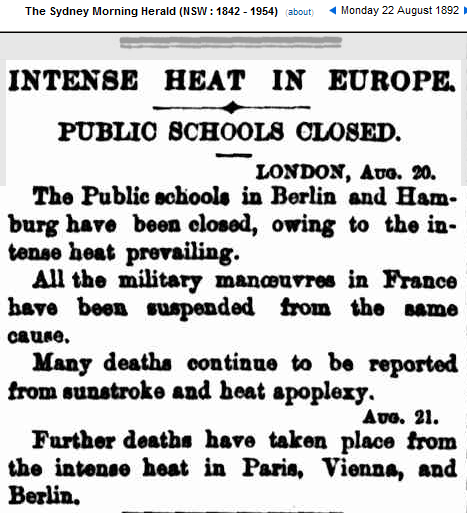
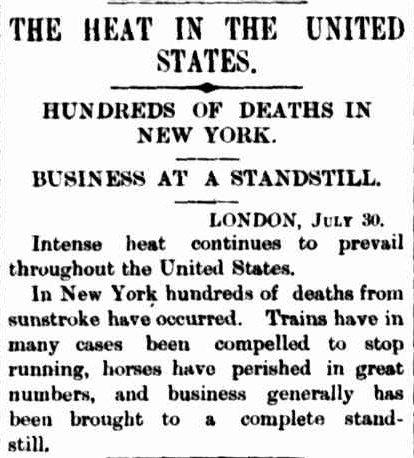
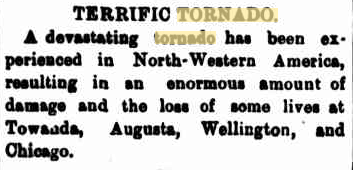
1892 saw horrific flooding in China, terrible heat and drought in Australia, heat and drought in Europe, a massive typhoon in Japan, crippling heat in the US, and terrible tornadoes.
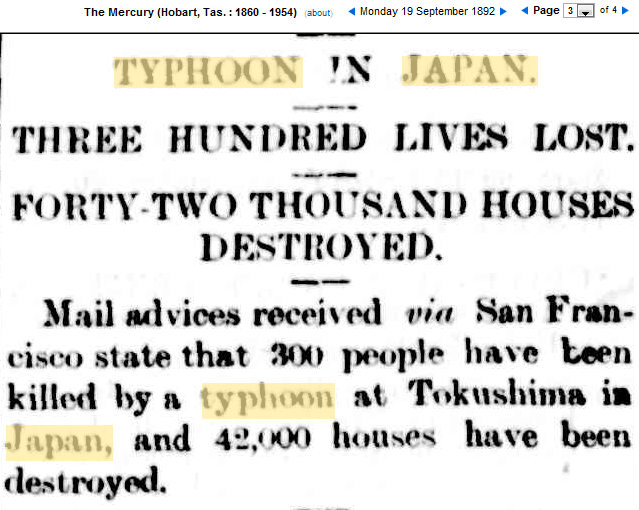
http://trove.nla.gov.au/ndp/del/article/8445064?
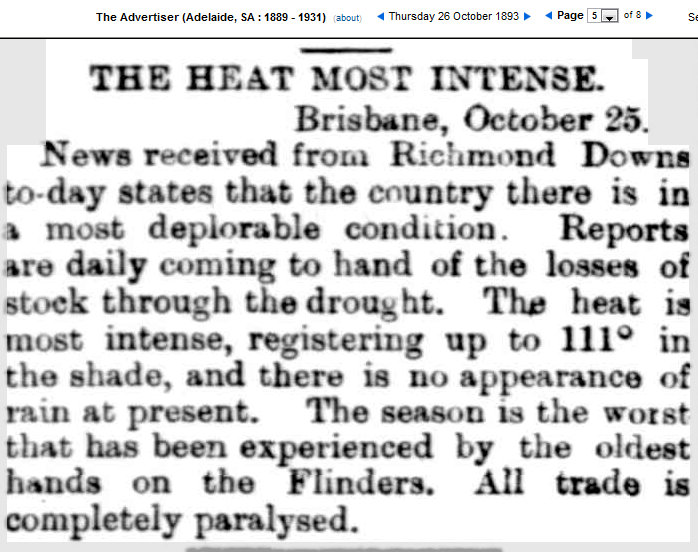
1893 saw record heat in Australia
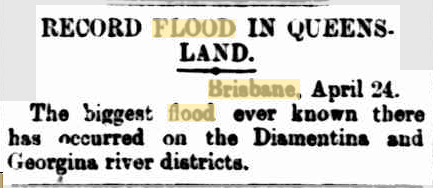
1894 saw massive forest fires in the US and record flooding in Queensland.
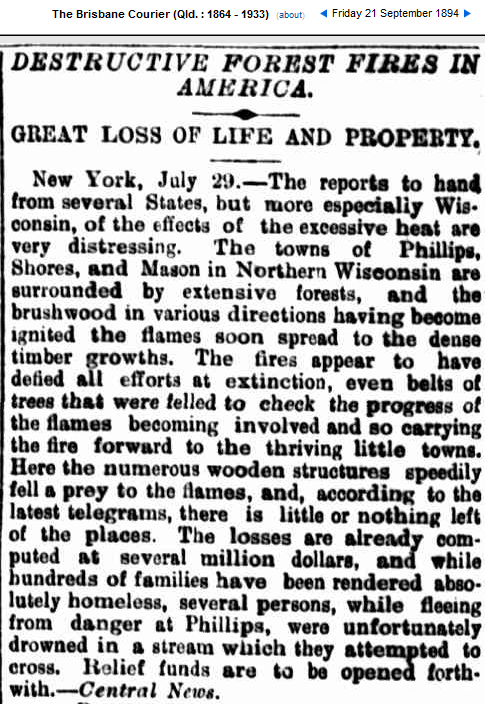
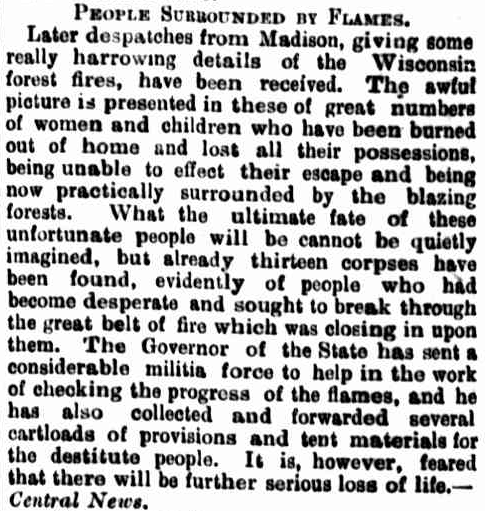
http://trove.nla.gov.au/ndp/del/article/3587788?
There is abundant evidence that Hansen’s idea of a stable climate comes from a spectacular lack of historical knowledge about past climate. The climate never was and never will be stable.









New research indicates that we may not even be able to cut CO2 levels even if we stopped all emissions:
http://reasonabledoubtclimate.wordpress.com/2011/08/05/game-changer-for-carbon-dioxide-emissions/
Everyone by now should know they have lied about past temperatures….
..might as well lie about past CO2 levels too
http://www.warwickhughes.com/icecore/call2.jpg
lol, yep….turns out much of what is generally accepted as true in climate science is just some fabrication.
Latitude:
YA think! To many extenuating circumstances to have any faith in the reality of Human Induced Climate Corruption. Or HICC for those who prefer acronyms.
A safe level of CO2 would allow plants the amount that gives them the best conditions, 1200 to 1500 ppm.
Weather has nothing to do with CO2!
CO2 IS GOOD!
You want to see a real hurricane season? Look at 1893:
August 24: CAT one hurricane passes directly over NYC with 85 mph winds. At least 34 dead.
August 27: CAT four hurricane moves inland near Savannah, GA, 1,000-2,000 fatalities.
Sept 7: CAT two hurricane moves inland over Louisiana
Oct 2: CAT four hits Louisiana and Mississippi coast, 2,000 fatalies
Oct 13: CAT three hits SC, at least 28 fatalities
Oct 23: strong tropical storm passes east of FL and moves inland near Chesapeake Bay with 60 mph winds.
So the low CO2 weather of the 19th Century was not exactly perfect all the time.
What a collection! Brighton and Ilfracombe, aah, I remember them well. But how do you dig these clippings up? My god, heat in Australia!! What next?
I read a paper months ago that had the actual data from the 19th cent of atmospheric CO2 measurements. Yes they could do this back then and fairly accurately.
These measurements were taken all over Europe and varied between 350-495ppmv. Nowhere was it as low as 300ppmv.
Wow good job, well done.
There are some obsessed with the supposed increase of 280 ppm to 392ppm of CO2. I hope that this information will help them to sleep better at nights. This, I hope, will put this into some kind of a perspective that makes one understand just how insignificant this increase is.
A part per million is like 1 drop of ink in a large
kitchen sink.
A large kitchen sink is about 13-14 gallons. There
are 100 drops in one teaspoon, and 768 teaspoons
per gallon.
Some other things that are one part per million are…
One drop in the fuel tank of a mid-sized car
One inch in 16 miles
About one minute in two years
One car in a line of bumper-to-bumper traffic from
Cleveland to San Francisco.
One penny in $10,000.
I know that you understand that these 112 additional ppm are spread out over this 16 miles in different one inch segments and wouldn’t it be a task to be told to sort out the 392 pennies from the number that it would take to make up $10,000.
At 392 parts per million, CO2 is a minor constituent of earth’s atmosphere– less than 4/100ths of 1% of all gases present. Compared to former geologic times, earth’s current atmosphere is CO2- impoverished. Please explain how this CO2 is going to act like a pane of glass in a green house when as the various spheres that compose the earth’s atmosphere increase in altitude they obviously increase in area and when was the last time you were able to “trap” anything using a gas?
I think that a blind person would have a better chance of experiencing honesty and the truth if involved in a high stakes game of scrabble with a band of Gypsies than what we will ever realize coming from James Hansen. It does seem that, in most respects, that the alarmist try to remain blind to what the truth is if it doesn’t fit into their ignorant preconceived idea of what their “truth” is