
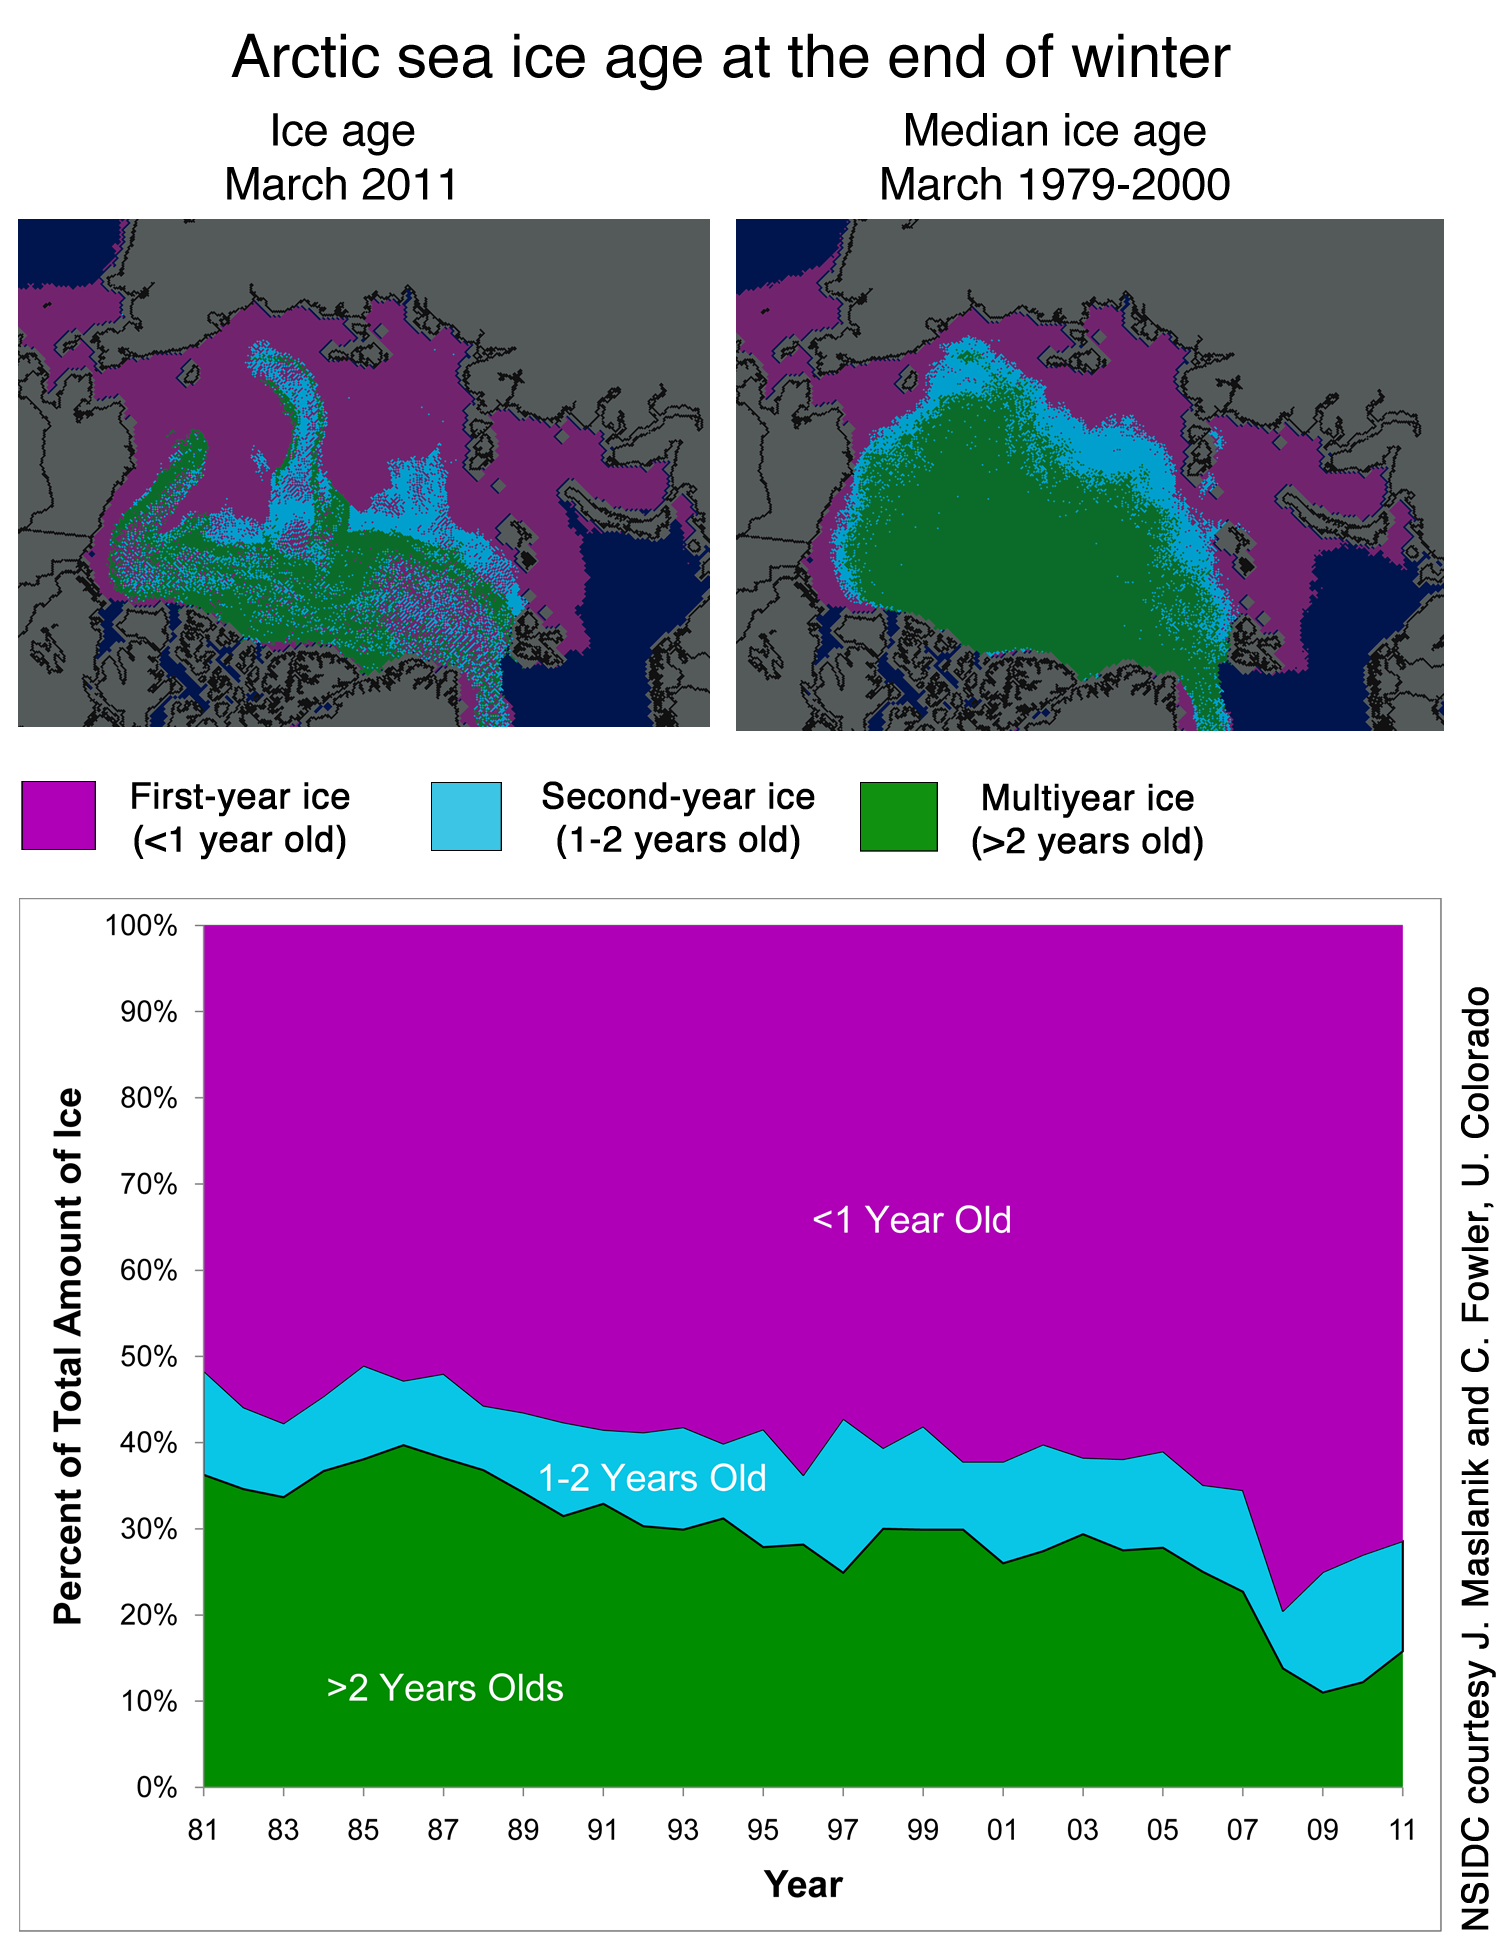
The reason why NSIDC showed “record low” extent in July was due mainly to low extent in the eastern Arctic, near Siberia. This area is pretty much of a don’t care, because there was no MYI there in the spring. MYI has largely survived the summer again, indicating that the ice continues to recover from 2007.


How does ice breaker activity effect the eastern Arctic? Seems like they are working hard to keep that somewhat open.
The Russians have kept that side open, year around, ever since their nuclear icebreakers were commissioned…….They are re-fitting the old ports to use as oil and gas exploration advances. They have found huge deposits up there, and oil and gas are the main drivers of their economy.
http://www.youtube.com/watch?v=DFvkhzkS4bw&feature=player_detailpage
How does that effect the historical ice area? Seems like that has to have an impact. How can you get multi year ice built up if it is contstantly being smashed into little pieces as it forms?
and little pieces melt faster and get blown around more……..
It’s really hysterical…..
..on one side you have people counting ice cubes
and on the other, you have people dropping bombs out of planes to blow them up
What is the most desolate place you can think of…..
….Pevek would be on that list
The Russians are building a new highway to Pevek…..
…so more Russian tourists can see more poley bears?……………not
Steve, interestingly enough it’s the Beaufort and Chukchi seas that have more recently been the regions of large multiyear ice loss. The seasonal ice loss in these seas has increased has also increased.
Here are some #s for you for the Beaufort sea (between March and September)
1980s; 27% reduction
1990s; 33% reduction
2000s; 49% reduction
1979-2006; 33% reduction
2007-2010; 67% reduction.
In 2010 there was a 73% reduction. 2007 it was 61%, 2008 it was 75% and in 2009 it was 59%. You might recall that in 2010 the old ice that was transported into the Beaufort/Chukchi seas melted out, rather than replenishing the multiyear ice cover. In my opinion, this is the region to keep an eye on, as it will be important for the future evolution of the sea ice cover. Recirculation of sea ice within the Beaufort Gyre is critical to replenishment of the multiyear ice lost each year from melt and/or transport. The less time that sea ice spends in the Beaufort Gyre, the less time it has to thicken through growth and deformation and the sooner it will experience another melt season.
I completely agree, and that was largely the point of this post.
Gotcha.
some #s for the Chukchi sea….from 1979-2006 the average seasonal ice loss was 63%, the last 4 years it was 99%.
Not surprising, given that thick ice was not present at the start of the summer.
> indicating that the ice continues to recover from 2007.
Not much of a recovery given area is still below 2007 same date. Steven, are you prepared to change refrain to “recover from 2011”?
Did you actually read the article before making that comment?
Do you consider less ice but more MYI a recovery?
I think that the extent of first year ice is almost completely meaningless.
I think the idea of second year ice materializing out of nothing completely useless.
There is plenty of first year ice in the western Arctic, which is where you want it to be if you are a fan of ice.
You mean the green area in the map above?
With ample evidence that many cyclical patterns are expressed in climate history, why now would anyone chose to assume that current change is a linear function? This supposedly significant “history” is a mere 30 years.
I doubt Reid Bryson looked happily upon his own observation in the late 70s that there was “No end in sight” to the cooling. Of course there was no end in sight. We have little idea what drives it.
Ice melts. Big deal.
The suspense is killing us. Only one month until we can make a final determination of angels dancing on the head of a pin. That is all it is, unless there is a consensus of breakout, one way or another.