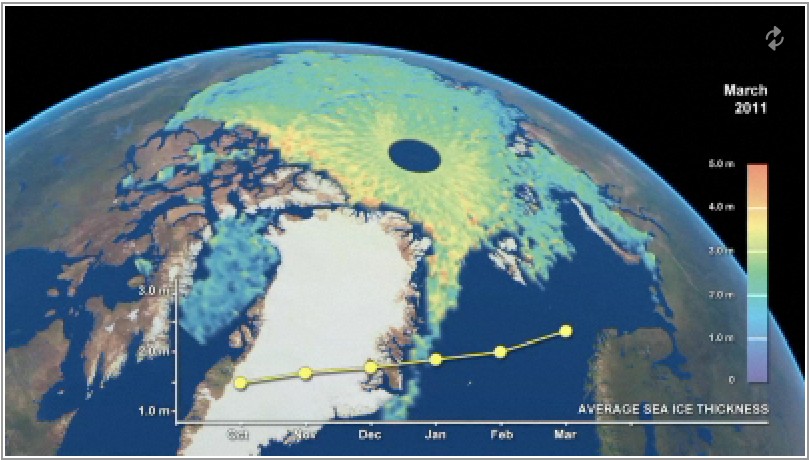
CryoSat shows that Arctic sea ice averaged 2.0 meters (6.5 feet) thick in February, 2012.
http://www.esa.int/SPECIALS/Cryosat/SEMU55NW91H_0.html
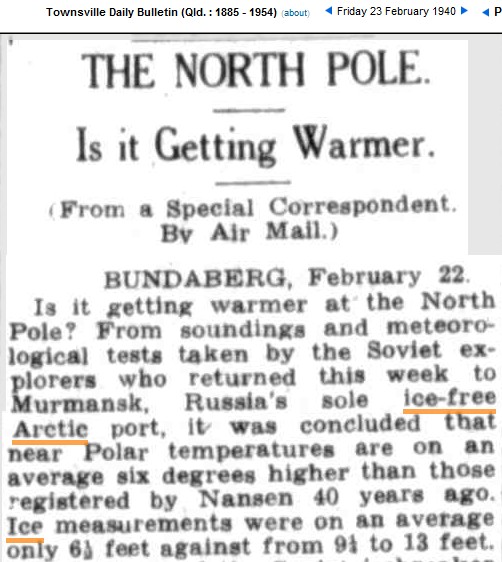
In February 1940, Arctic ice also averaged 6.5 feet thick. Ice thickness is the same as it was 72 years ago.


Steven,
Satellite measurements – interesting. Doesn’t look like a death spiral to me though.
Are you planning on a revisit of PIOMASS anytime soon? I was revisiting this link http://wattsupwiththat.com/2010/06/01/piomas-non-verification-ii/
And followed it to another link where a commenter was predicting an ice-free Arctic by 2014 and was willing to put $100 on it back then. Boy, all those confident voices predicting an ice-free Arctic seem to have disappeared from the climate blogs…
Last time I checked PIOMASS it looked to me like their “ice volume” minimum was headed for an ice-free Arctic by something like 2015 to 2020. (Just eyeballed the graph…).
Yes I am planning on humiliating PIOMAS again very soon.
http://www.youtube.com/watch?v=EGekq3Jt5Go
Laz, Peter, D A, et al.
“Examination of records of fast ice thickness (1936–2000) and ice extent (1900–2000) in the Kara, Laptev, East Siberian, and Chukchi Seas provide evidence that long-term ice thickness and extent trends are small and generally not statistically significant, while trends for shorter records are not indicative of the long-term tendencies due to large-amplitude low-frequency variability. The ice variability in these seas is dominated by a multidecadal, low-frequency oscillation (LFO) and (to a lesser degree) by higher-frequency decadal fluctuations….”
http://journals.ametsoc.org/doi/pdf/10.1175/1520-0442%282003%29016%3C2078%3ALIVIAM%3E2.0.CO%3B2
Bill Pounder,
Thanks for the link. Interesting paper written late 2002. After reading the paper, I was hacking around on Google to get some background and ran into this blog post written in 2004:
http://www.worldclimatereport.com/index.php/2004/12/10/open-letter-to-senator-mccain/
It is interesting that this side of the scientific story rarely (if ever!) gets any traction. But run the tape forward from 2002 to the Death Spiral days of 2007 and in 2007 I dug up on the internet that the PI on the paper you reference, Dr Polyakov, predicted 2008 would see more Arctic Ice loss…he got that one wrong though.
I also found that Dr Polyakov has noted a switch to lower Arctic Temperatures:
http://www.iarc.uaf.edu/jp/JAMSTEC/research/monitoring-arctic-ocean-climate
“Recent 2008–09 observations suggest that the ongoing warm surge passed its peak and the eastern Arctic Ocean is in transition to a cooler state. Stronger cooling of ?1.5°C is found in the western Nansen Basin, near the origin of AW for the Arctic Ocean interior. Expectedly, weaker cooling of ~0.5°C or even less were documented further downstream from Fram Strait, in the eastern Eurasian Basin (Fig. 3). Comparison of CTD observations carried out north of Franz Josef Land (~60°E) in 2007 and 2009 was ~0.4°C (not shown) providing further confirmation for this cooling tendency.”
Screaming Arctic Death Spiral just doesn’t look real. Makes for a great (sensationalist) newspaper headlines though.
This is in fact REAL SCIENCE only one liners needed with the data. A bit like Einsteins paper (one page). The guy was ostracized by the know it all crowd who finally conceded as will the real scientists involved in climate science (even current believers will be conceding or are starting to)
Isn’t that data for last year??
Good point. It is thicker this year.
Satellites have already shown that the extent of sea ice in the Arctic is diminishing. In fact, spring 2011 is the third lowest extent recorded by satellite.
http://www.esa.int/esaLP/SEMAAW0T1PG_LPcryosat_0.html#subhead4
More data from Cryostat.
Wish you guys would read through your sources. Or maybe I should wish you guys would just, you know what, read.
May 3, 2012
Arctic sea ice reaches near-average extent in April
http://nsidc.org/arcticseaicenews/2012/05/arctic-sea-ice-reaches-near-average-extent-in-april/
Sea ice extent now diminishing fast and approaching the 2007 record, which is consistent with reduced average ice thickness last winter. Will you report this?
You mean above normal?
http://stevengoddard.wordpress.com/2012/05/08/arctic-ice-area-above-normal/
World looks a bit different in late August.
Care to update your views, or adjust your tone?
The Russians way back in 1940 measured the ice thickness at a few places. Let’s assume they actually measured what has been reported above. Was this first, second or third year ice they were measuring. They measured temperature while they were there. Was this in the same location where previous measurements had been made. How long did their series of measurements last. What was the weather pattern at the time. They left from their only ice free port. Were they measuring the temperature and ice thickness that they first came to near where the gulf stream warms that area. Sorry guys. You can’t take much comfort from the 1940 measurements compared with many years of recording weather stations around the Arctic ocean and satellite measurements of the whole ice sheet. It is like me going out and measuring the temperature where I live and then trying to make the case that the temperature is warming or cooling when I compare this spot temperature with the long term average for my region.
How is your comfort affected by Arctic ice thickness?