Michael Mann introduced a new concept of fraud to science, when he threw out the tree ring data after 1960.

Briffa’s trees (green above) accurately showed the same post 1940 cooling as the 1975 report of the National Academy Of Sciences.

www.sciencenews.org/view/download/id/37739/name/CHILLING_POSSIBILITIES
Mann didn’t like that data, because his job was to eliminate the MWP. So he simply threw out the proxy data after 1960, and replaced it with Hansen’s doctored thermometer data.

Once Hansen and Mann had cleared the way for the biggest scientific fraud in history, it became possible to do the same with sea level.
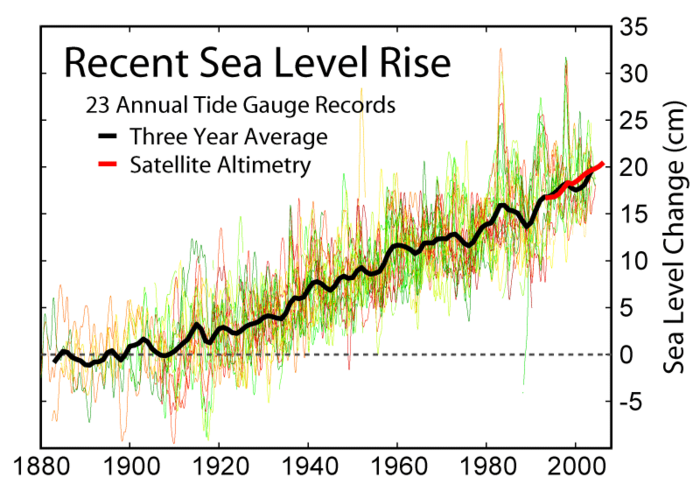
A set of tide gauges (hand chosen by alarmists) indicated a steady rise in sea level of 1.8 mm/year since 1910.
700px-Recent_Sea_Level_Rise.png (700×491)
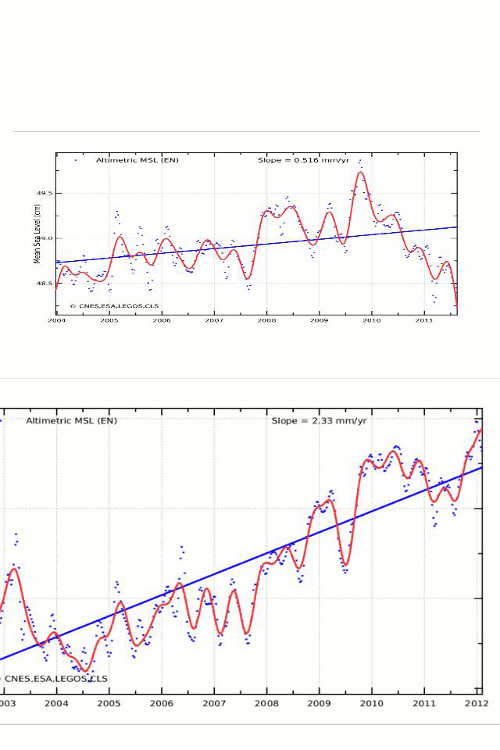
The full set of NOAA tide gauges indicates a much smaller rise of about 0.7 mm, but that isn’t my point here. The 1.8 mm/year wasn’t very threatening, so our alarmist friends chose instead to simply toss the tide gauge data and replace it with corrupted satellite data which showed closer to 3 mm/year – after being tortured upwards. The blink comparator below shows how Envisat satellite sea level data was massively corrupted earlier this year to make it more suitable for propaganda purposes.

In summary, the cherry-picked set of tide gauges wasn’t good enough, so alarmists chucked their own tide gauge data, and replaced it with corrupted satellite data.
The remarkable thing though, is that even after switching systems and corrupting the new data, sea level is still rising about ten times too slow to match Hansen’s projections.


So that’s what they meant by “join the dots”
The „sciencenews“ image is remarkable for the sudden temperature trend change at the onset of the 2nd World War in winter 1939/40, see here: http://www.seaclimate.com/a/a3/rigtht/big/a3-7.jpg
The shift came with the three extreme cold winters in Europe 1939/40, 1940/41, and 1941/42
http://www.seaclimate.com/b/images/buch/big/B-3.png , showing that the world was still above average, and only Europe in the cold, with further explanations here: http://www.seaclimate.com/b/b.html , showing the likely cause has been the naval war, by cooling down the seas in Northern Europe during the winter seasons more than was usually the case.
GIA is the most recent attempt to manipulate the public.
I wonder how venerable academic institutions like UC, will recover from their massive loss of credibility that is just around the corner.
GIA is a tiny part of the problem.
Do you know that UC’s 0.3 mm/year GIA “correction” is a volume correction, not a level correction? Carefully read the FAQ:
http://sealevel.colorado.edu/faq#n3113
Unfortunately, their sea level graphs incorrectly add it to sea level.
Steve, I did a post the other day on CU’s graph. (the one that conflates the Topex, Jason I and then Jason II.)
Their math is wrong. They’re reporting an aggregate of 3.1mm/yr rise for the 20 year history. With in the time frames they use for each satellite, only Topex reported a rise of 3.1mm/yr
Jason I, from beginning time (start of 2002) to when Jason II came online (mid 2008) Jason I reports a rate of rise to be 2mm/yr (for 7.5 years)
Jason II shows 1.25mm(linear trend) or 1.44mm/yr total for the 3.5 years. I didn’t include the GIA, but even if I did, there’s no way in the aggregate the 3 come up with a total rate of rise to 3.1mm/yr. CU uses the seasonal adjustment, so I included it as well.
http://suyts.wordpress.com/2012/06/10/sea-level-satellites-need-further-adjustments/
I thought maybe you might want to dig a bit deeper into this, it could be an excellent opportunity to laugh at CU some more.
Interesting.
CU (home of Ward Churchill) has the largest turnout for National Marijuana Day of any college in the country. Many people down there are stoned.for at least some portion of the week. It is all about saving the planet.
Lol, well, yes. I actually think those loons are better when they are stoned. They’re less energetic with their stupidity.
Reblogged this on Climate Ponderings and commented:
Ed Caryl says:
June 17, 2012 at 4:35 pm
Do you know that UC’s 0.3 mm/year GIA “correction” is a volume correction, not a level correction? Carefully read the FAQ:
http://sealevel.colorado.edu/faq#n3113
Reply
stevengoddard says:
June 17, 2012 at 4:39 pm
Unfortunately, their sea level graphs incorrectly add it to sea level.