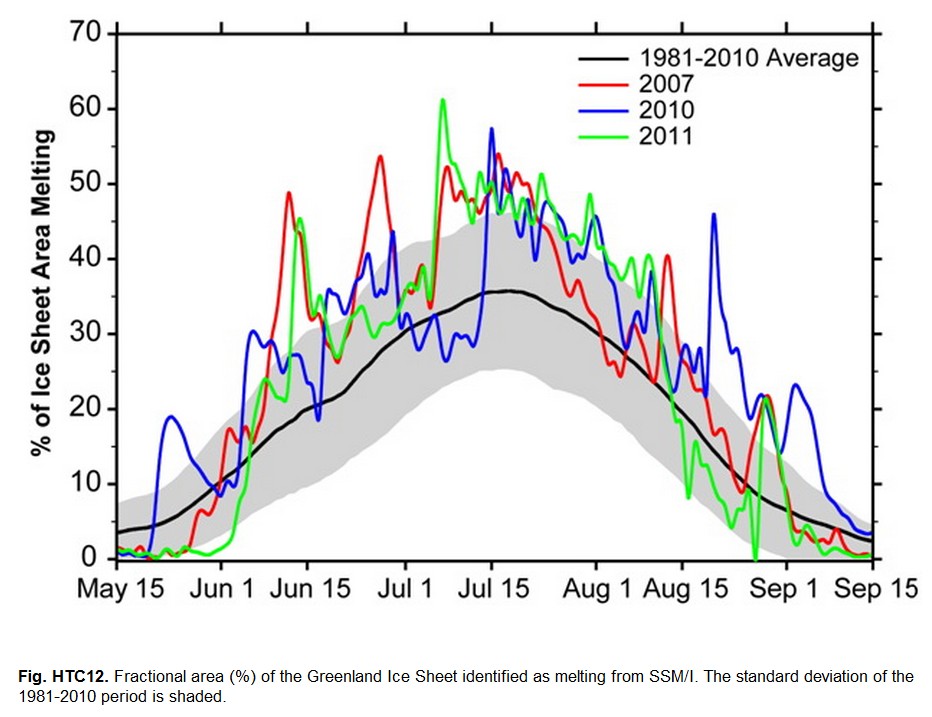
Our top scientists generated this graph, which shows that the area of summer melt in Greenland is faster than it was in 1981.
Arctic Report Card – Greenland Ice Sheet – Box, et al.
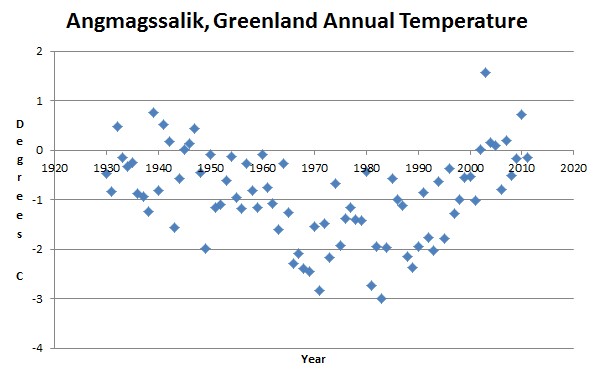
Of course, they didn’t bother to mention that they started their “normal” period right at the coldest years of the ice age scare.
Had they used the 1930-1950 average as their normal period, their graph would have been no use to Joe Romm.


Is 3 years of carefully picked cherries enough evidence for Box-o-rocks to determine the demise of Greenlands glaciers? I’m confused because when folks like Anthony Watts point to 15+ years of evidence for lack of warming global temperatures, he is labeled as a dangerous denier by eco-fascists like Bill McFibbin. Does this make me a confusionist? 🙂
The warmists like to conveniently discount both the hot period from 1930 to 1950 and the cold period from 1960 to 1980. Also the cooling since 1998. With proper “adjustments”, they can manufacture an ever upward stepping stone temperature graph, rather than a cyclical up and down temperature pattern that has actually taken place.