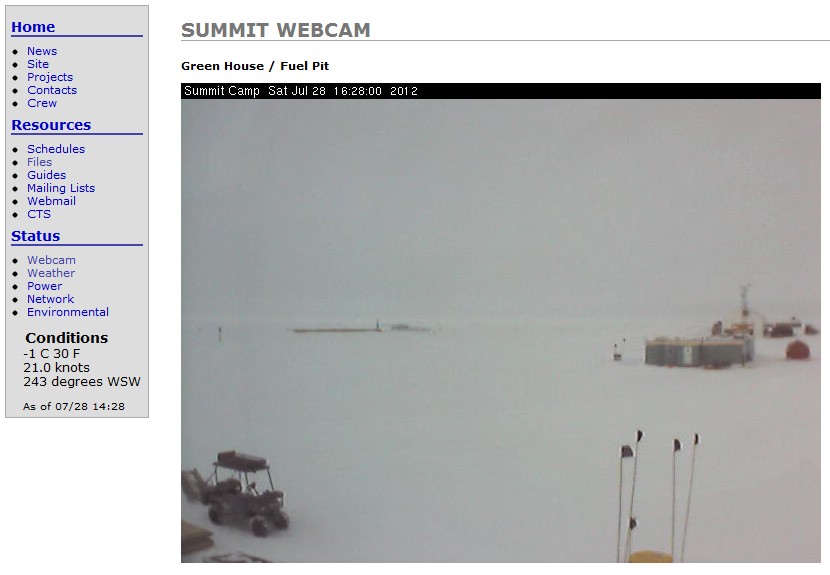
The heat is on at meltdown part deux, and the beer cart has arrived.
Disrupting the Borg is expensive and time consuming!
Google Search
-
Recent Posts
- Gaslighting 1924
- “Why Do You Resist?”
- Climate Attribution Model
- Fact Checking NASA
- Fact Checking Grok
- Fact Checking The New York Times
- New Visitech Features
- Ice-Free Arctic By 2014
- Debt-Free US Treasury Forecast
- Analyzing Big City Crime (Part 2)
- Analyzing Big City Crime
- UK Migration Caused By Global Warming
- Climate Attribution In Greece
- “Brown: ’50 days to save world'”
- The Catastrophic Influence of Bovine Methane Emissions on Extraterrestrial Climate Patterns
- Posting On X
- Seventeen Years Of Fun
- The Importance Of Good Tools
- Temperature Shifts At Blue Hill, MA
- CO2²
- Time Of Observation Bias
- Climate Scamming For Profit
- Climate Scamming For Profit
- Back To The Future
- “records going back to 1961”
Recent Comments
- Bob G on Gaslighting 1924
- Bob G on Gaslighting 1924
- conrad ziefle on Gaslighting 1924
- Bob G on Gaslighting 1924
- Bob G on Gaslighting 1924
- arn on Gaslighting 1924
- conrad ziefle on Gaslighting 1924
- Gordon Vigurs on Gaslighting 1924
- conrad ziefle on Gaslighting 1924
- Robertvd on Gaslighting 1924


Only 2 degrees F below freezing. Quite balmy thanks to the Southerly breeze.
The temperature is rather high. Apart from the event on 11 July this year I could only find two other July observations in the last 8 years of their data that were >= -2C; the warmest was -1.3 on 23 July 2006. The other one was -2.0C on 23 July 2005.
I did find 2 days where the sign was missing on the temperature giving ridiculously high readings 🙂
I sure hope they remembered to bring plenty of ice!
BEST op-ed in NYT this week. Muller all in on CAGW narrative. Please comment.
http://reason.com/blog/2012/07/28/new-global-temperature-data-reanlysis-co
And how odd that Anthony’s got something in the works, too.
Here’s a comment. Muller is short of climate ca$h.
How definite is the attribution to humans? The carbon dioxide curve gives a better match than anything else we’ve tried.
They should have tried US postal rates:
http://joannenova.com.au/2009/05/shock-global-temperatures-driven-by-us-postal-charges/
Looks a lot better correlation than CO2.
us debt (climate ca$h, wars, big government) match co2 curve even better
http://solari.com/blog/wp-content/uploads/2012/04/US-National-Debt-Chart-2012_SM_330x498.jpg
Now that’s a hockey stick!
DMI has a fine figure of the temperatures at Summit in several years http://www.dmi.dk/dmi/groenland2.gif Many dots over zero over the years
Now that’s funny! 😆
This would be a great place to shoot a beer commercial, nice and cold, year round.