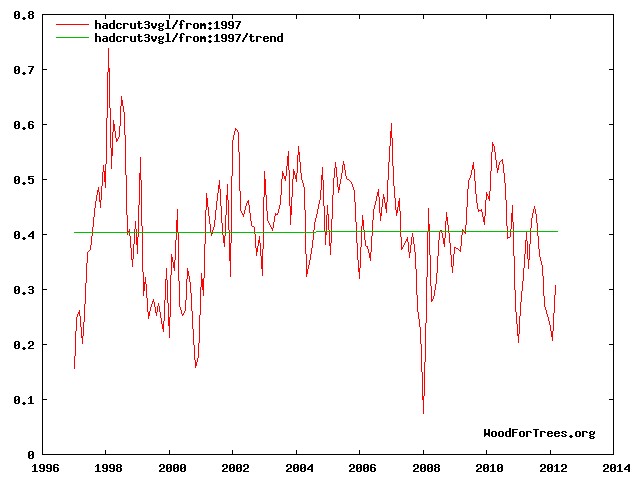
Fifteen years of no temperature rise, while government has spent hundreds of billions of dollars trying to scare us over a total non-event.
Disrupting the Borg is expensive and time consuming!
Google Search
-
Recent Posts
- Gaslighting 1924
- “Why Do You Resist?”
- Climate Attribution Model
- Fact Checking NASA
- Fact Checking Grok
- Fact Checking The New York Times
- New Visitech Features
- Ice-Free Arctic By 2014
- Debt-Free US Treasury Forecast
- Analyzing Big City Crime (Part 2)
- Analyzing Big City Crime
- UK Migration Caused By Global Warming
- Climate Attribution In Greece
- “Brown: ’50 days to save world'”
- The Catastrophic Influence of Bovine Methane Emissions on Extraterrestrial Climate Patterns
- Posting On X
- Seventeen Years Of Fun
- The Importance Of Good Tools
- Temperature Shifts At Blue Hill, MA
- CO2²
- Time Of Observation Bias
- Climate Scamming For Profit
- Climate Scamming For Profit
- Back To The Future
- “records going back to 1961”
Recent Comments
- Bob G on Gaslighting 1924
- Bob G on Gaslighting 1924
- conrad ziefle on Gaslighting 1924
- Bob G on Gaslighting 1924
- Bob G on Gaslighting 1924
- arn on Gaslighting 1924
- conrad ziefle on Gaslighting 1924
- Gordon Vigurs on Gaslighting 1924
- conrad ziefle on Gaslighting 1924
- Robertvd on Gaslighting 1924


AMS says of IPCC models, “The simulations rule out (at the 95% level) zero trends for intervals of 15 yr or more, suggesting that an observed absence of warming of this duration is needed to create a discrepancy with the expected present-day warming rate” and would then be falsified at the 95% level. Page 24 of this PDF
http://www1.ncdc.noaa.gov/pub/data/cmb/bams-sotc/climate-assessment-2008-lo-rez.pdf
So the HansenSoft adding machine is broken then.
Using NCEP’s own data from the beginning of 2008 shows a jagged cooling beginning likely due to the -PDO, and soon by the end of the decade, the AMO will follow, and we’ll really get some cooling!!
Hi, Im French sorry for my English.
The AMO should follow the sun with a lag about 8 or 9 years, so i think between 2015-2020 AMO will be pass in cold mod.
PDO will be negative for 30 years now, and AMO will be negative from 2015-2020 to 2048, the solar will be quiet for 30-40 years too.
The next global cooling could looks like Dalton or Spörer minimums, if we have a big volcanic activity.
Nice comment. Your English is better than my French (i.e. I do not know French at all).
You know you are supposed to be using the much superior Hadcrut4 data now. You know, the one where they nearly removed the 1998 El Nino: http://www.woodfortrees.org/plot/hadcrut4nh/from:1996/plot/hadcrut4nh/from:1996/trend
1998 never happened. Like the 1930s. The Ministry of Truth has removed it.
Exactly ! Hide the Decline ! This is like Hansen for the temperature peak of 1930-1940 is USA, Island …
The IPCC said climate is definite about 30 years ago, but if they take 60 years, the don’t see the cooling of 40-70’s and the Warning of 10-40’s ! There is a cycle of 60 years ago for the climate variability, more here:
http://www.appinsys.com/globalwarming/SixtyYearCycle.htm
Take a look at 30 years of data if some think 15 is too short:
http://www.woodfortrees.org/plot/hadcrut3vgl/last:360/plot/uah/last:360/plot/rss/last:360/plot/gistemp/last:360
At the current rate, assuming warming continues, we might see a 1C or so rise by 2100. (In other words, a global net benefit to the planet by that stage.)