Someone was on here earlier trying to claim that the large adjustments I am seeing are due to not properly adjusting for areal distribution.
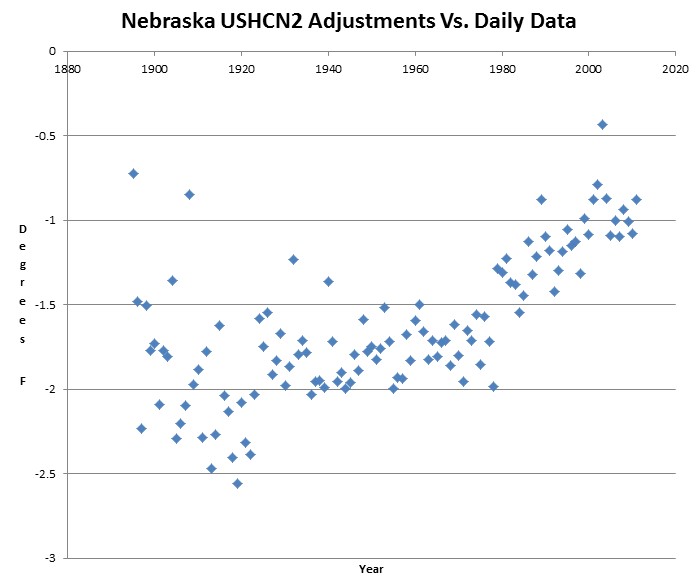
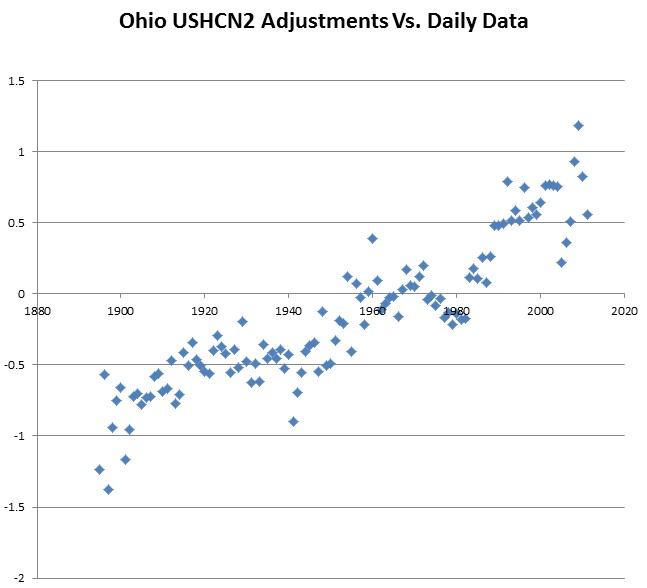
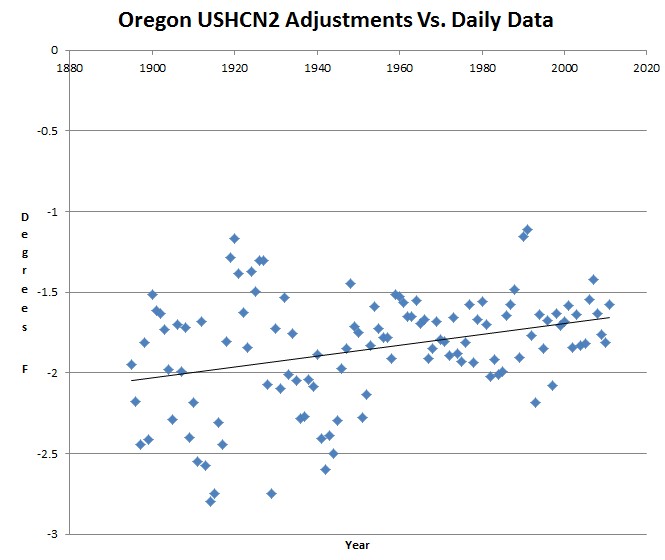
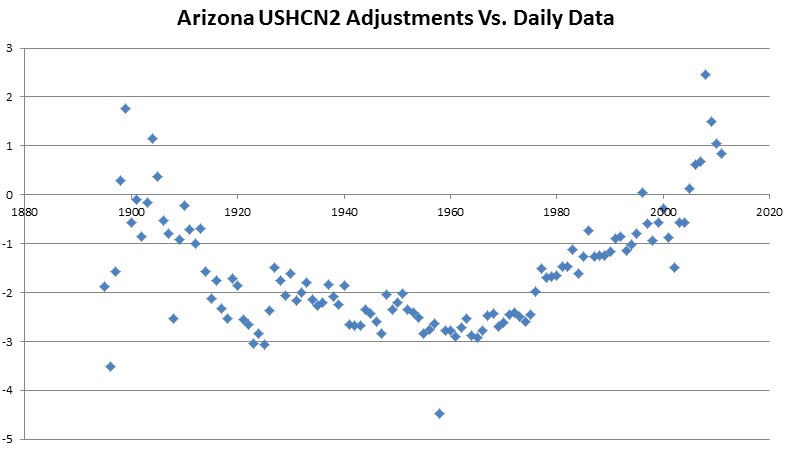
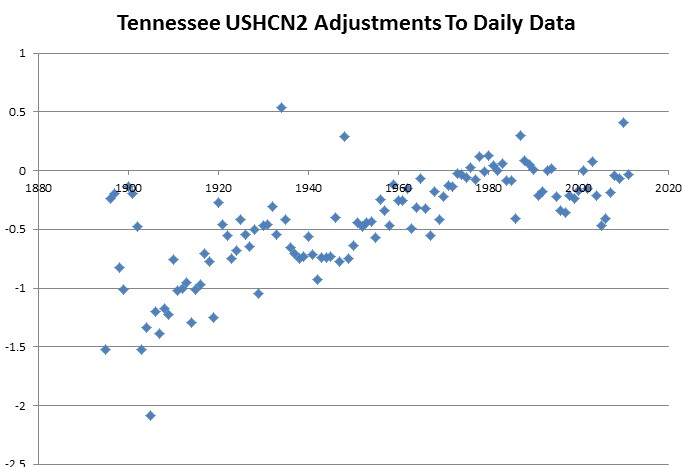
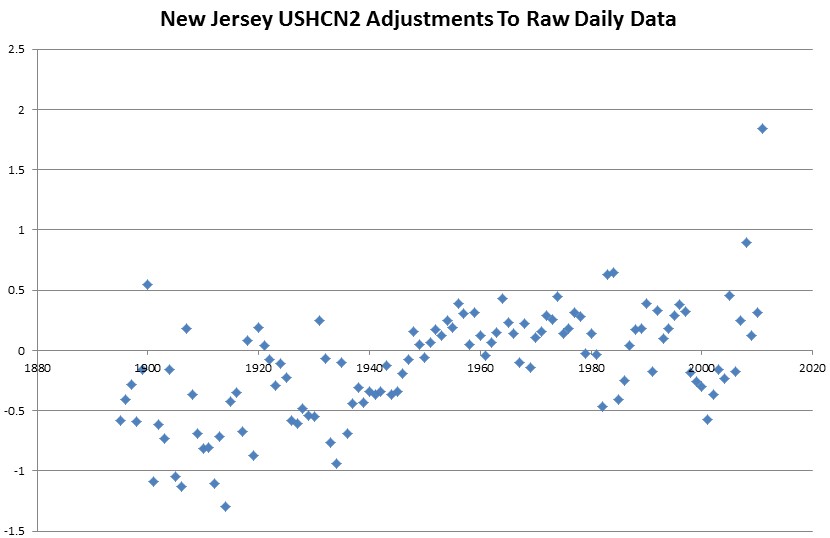
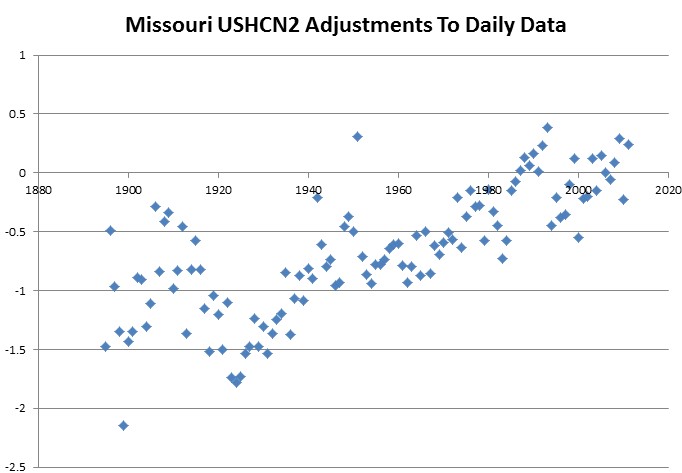
What a load of crap – the USHCN stations are intentionally distributed fairly evenly and the same patterns are seen in the state data as are seen in the national data. The 1930s are being cooled in the vast majority of states.
The titles to the graphs are not consistent below, but they all show the same data – NCDC vs. average of all daily data.
Nebraska hottest year – 1934
Ohio hottest year – 1921
Oregon hottest year – 1934

Texas hottest year – 1921
Arizona hottest year – 1896
Tennessee hottest year – 1921
New Jersey hottest year – 1998
Missouri hottest year – 1921


The problem is also that the NCDC data changes monthly. If you looked at what the temperature was in the database for 1915 was in the database in 2008 and looked again today, you would see that today’s temperature in the database is about 0.1 degrees cooler. This diagram shows the accumulated changes between 2008 and May 2012:
http://climate4you.com/images/NCDC%20MaturityDiagramSince20080517.gif
I’ve noticed that too. US Weather Bureau records from the 1930s were consistently higher than what is in the USHCN database, What a load of horseshit this whole scam is.
Steve, your BS detector is working well today.
Unfortunately, you and me and almost everyone else bought postmodern scientific models of reality as a substitute for observations on reality after 1945, . . . without detecting the odor!
Thanks to the Climategate emails and documents that were released in 2009 and the strange responses of world leaders and leaders of the scientific community, including the US National Academy of Sciences, the UN’s IPCC, the UK’s Royal Society, the Nobel Prize Committee and the editors of leading research journals like Nature, Science, MNRS, PNAS, etc., ad infinitum
The outline of the rise and fall of the scientific revolution and constitutional government is starting to become obvious: http://omanuel.wordpress.com/ and http://omanuel.wordpress.com/about
With kind regards,
Oliver K. Manuel
Former NASA Principal
Investigator for Apollo
http://www.omatumr.com
Steve, check out this new study. It totally supports what you have been saying for years.
http://itia.ntua.gr/en/docinfo/1212/
Steven , thanks again for your vigilance and tenacity in confronting the liars and thieves who are in control of the various government science organizations. To my knowledge you are in the forfront in hammering the people who would control us through bogus science. Yes your BS meter is working well .
The 120+ heat of the 1930’s is beyond belief for us who have lived thru many recent cool decades. Since it is beyond belief, it must be cooled! (sarc.)
There appears to be a little industry in climate science looking for ways to cool the past by homogenizing the data. They claim that all temperatures in the past were over-recorded because temperatures were taken on north facing walls and these were affected by the sun in the summer which in northern latitudes sets north of west and hence could shine on the thermometer in the late afternoon/early morning and increase the measurement. Later readings were taken with a shelter up against the wall which was open to the north and had no bottom so that, of course, over-read because of the sun heating up the ground below the shelter etc, etc, etc.
This paper (which has 31 authors- if such a thing is possible!) compares the various methods of getting a computer to make up the past and pretend it’s real:
http://www.clim-past.net/8/89/2012/cp-8-89-2012.pdf
I’m skeptical because none of these homogenization efforts take any account of stratification in the surface layer of the atmosphere nor do they take account of microclimates ie it is assumed that ‘nearby’ stations have a similar climate and hence anomalies can be transferred to the one with the missing/’erroneous’ data. Yeah, right.