Climate is the long term pattern of weather, and you can’t see long term patterns over a period of one week.
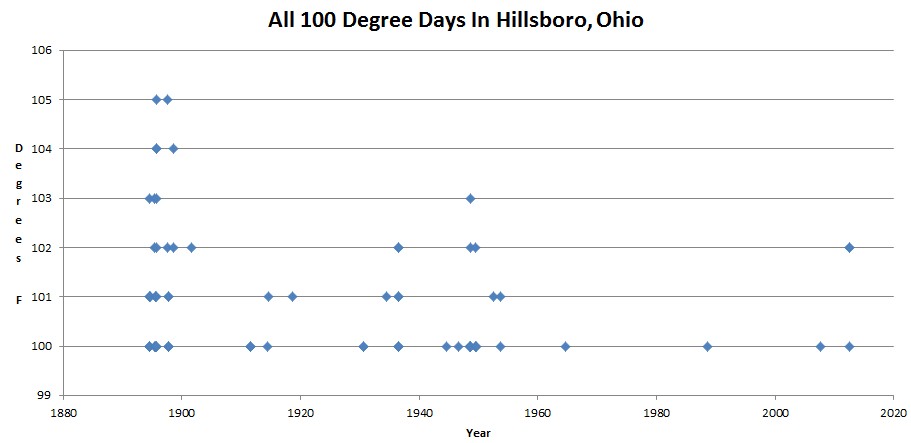
Consider Hillsboro, Ohio – the closest USHCN station to Cincinnati. Last week they had three days over 100F, the longest such hot spell since 1949. It would be easy to conclude that Hillsboro is experiencing climate change – unless you looked at the long term record.
The 1890s was by far the hottest decade in Hillsboro, with thirty-two 100 degree days. From 1900 to 1964, there were also thirty-two 100 degree days. But in the last 48 years, there have only been five. Hot days have been in sharp decline around Cincinnati for more than a century.
U.S. Historical Climatology Network
What is the difference between Trenberth and Sarah Palin? The difference is that Palin never said she could see Russia from her house.
[youtube=http://www.youtube.com/watch?v=ylDfs1lymfg&feature=player_embedded]


http://www.youtube.com/watch?v=8hEm6LiU3rw
I was pretty sure that these guys were telling us , two years ago that one could NOT see climate change by looking out the window.
I just can’t keep up.
Trenberth Says That He Can See Climate Change Out His Window
That’s the illusion you see when you sack the window cleaner.
Wow, just watching one minute of this video full of climate change BS wanted to make me throw up. Anyone got a doggy bag?
Looking at my hometown data, we have never hit 100F. Being right near Lake Superior, I suppose that’s the way it is. Our record stands at 99F. So I looked at number of days of 90F or more. Here’s what i found.
1894-1900 – 4
1901-1910 – 31
1911-1921 – 20
1921-1930 – 32
1931-1940 – 42
1941-1950 – 14
1951-1960 – 17
1961-1970 – 23
1971-1980 – 3
1981-1990 – 13
1991-2000 – 9
2001-2010 – 14
2011-present – 0
Years with 5 or more days.
1901 – 5
1905 – 9
1906 – 6
1910 – 7
1916 – 8
1925 – 8
1930 – 7
1933 – 7
1934 – 11
1936 – 9
1961 – 7
1963 – 6
Haven’t seen a 90F day since 2008. Might have got one today as it was very warm out. Local thermometers were in the low 90’s.
You are seeing why hansen has been working so hard to wreck the temperature data from the 1930s and 1940s.
GHCN runs the raw numbers through their mill, then Hansen does even more damage. I compared the GHCN v3 to his data for the early time periods, and Hansen cools them another 0.5C. I started here at this NASA site http://data.giss.nasa.gov/gistemp/station_data/
You can use GHCN data for your chart or GISS data. I actually opened this site again in another tab so I could compare charts and text. How convenient that they line up pretty good in the last 30 years or so. Hansen definitely tries to get the past as cold as he can.
I should say NCDC runs the raw numbers through their mill producing supposed real temperatures. Then Hansen goes to town on them. It’s astounding that he can get away with that. But I’m not surprised by our government anymore.