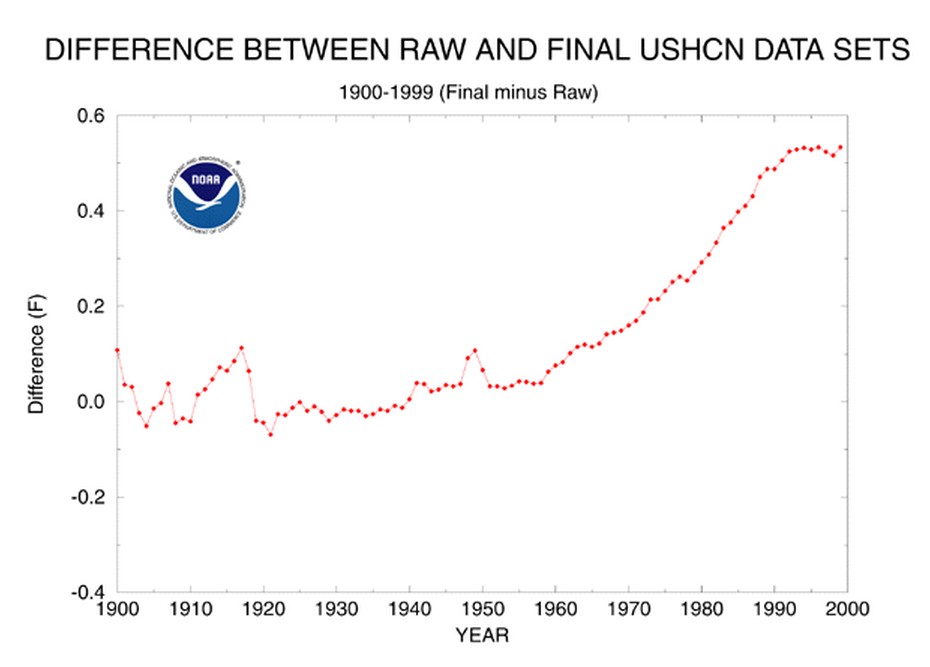
USHCN advertises that they cheat by 0.6F, but it is much worse than it seems.
ts.ushcn_anom25_diffs_urb-raw_pg.gif (650×502)
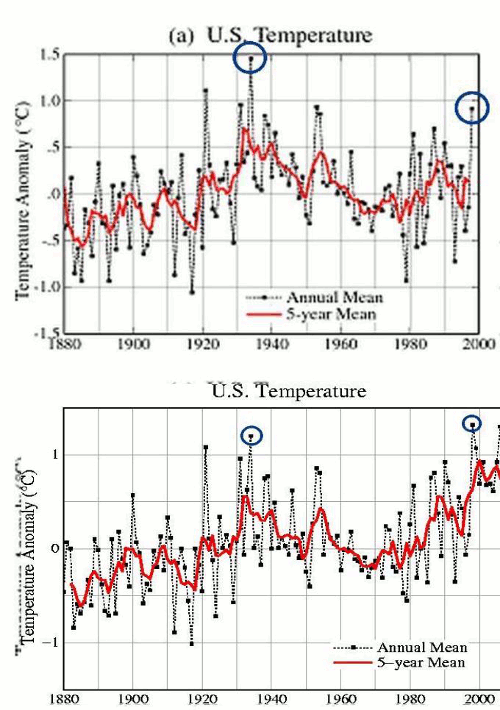
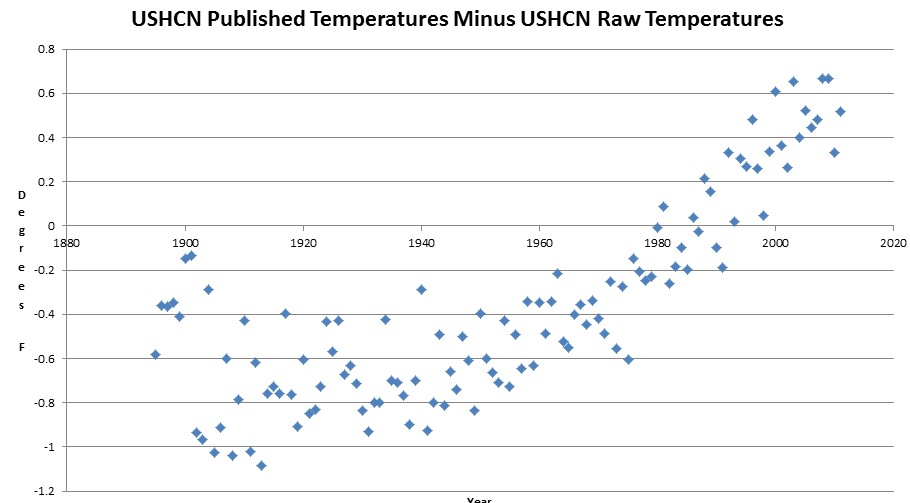
This is heinous enough, but I started thinking about it and realized that it doesn’t make any sense. We have seen hundreds of examples of them cooling the past, and their graph above doesn’t show that. So I calculated the actual adjustment by averaging all valid daily minimum and maximum temperatures at all USHCN stations (per year) and compared them to what they publish.
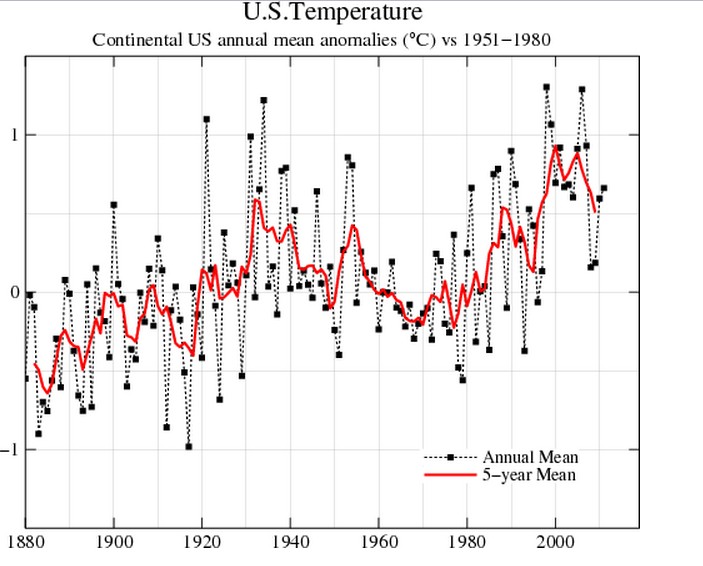
Their adjustment is much larger than what they admit, and it accounts for the entire claimed GISS US warming trend.
There has been no US warming. It was all manufactured by climate activists James Hansen and Tom Karl over the last decade.
Phil Jones and NOAA 1989
February 04, 1989
Last week, scientists from the United States Commerce Department’s National Oceanic and Atmospheric Administration said that a study of temperature readings for the contiguous 48 states over the last century showed there had been no significant change in average temperature over that period. Dr. (Phil) Jones said in a telephone interview today that his own results for the 48 states agreed with those findings.
Global Warmth In ’88 Is Found To Set a Record – New York Times
James Hansen 1999
Empirical evidence does not lend much support to the notion that climate is headed precipitately toward more extreme heat and drought. The drought of 1999 covered a smaller area than the 1988 drought, when the Mississippi almost dried up. And 1988 was a temporary inconvenience as compared with repeated droughts during the 1930s “Dust Bowl” that caused an exodus from the prairies, as chronicled in Steinbeck’s Grapes of Wrath…..
in the U.S. there has been little temperature change in the past 50 years, the time of rapidly increasing greenhouse gases — in fact, there was a slight cooling throughout much of the country


Well see, its real simple…
We perform adjustments that we don’t call adjustments, and then we adjust those adjusted un-adjustments to create the adjusted adjustments.
I hope its all clear now.
Again without proper adjustment for UHI which is an endemic problem for USHCN sites as Anthony Watts demonstrated. That applied there should be a significant cooling trend.
Steve, this is unfrickinbelievable. Where are you pulling the USHCN raw data from? I want to save a copy before NOAA pulls the data.
http://cdiac.ornl.gov/ftp/ushcn_daily/us.txt.gz
Who gave alarmists the right to “adjust” temperatures? Once the data is subjectively tainted by agenda driven fiends, there is absolutely no meaning to it. Then you add in “extrapolations” for areas where data is sparse and it is no wonder that every month is the warmest ever and every year is the warmest ever.
The really unbelievable part is the implied gradual warming bias as you go back in time. The “climate experts” teased this bias out of the data and are of course spot on regarding the temperature record. Mueller and BEST gladly took on the adjustment criticisms from Anthony W because that at least could be dealt with through sophistry. There is no explaining the bias of adj vs raw in total.
As Mosher would say “this is the way it is done”. Odd how he never confronts direct issues like this. Instead, he pops in at WUWT, insults a few people, says he is right then disappears from the scene. Drive-by posters are so irritating.
“There has been no US warming. It was all manufactured by climate activists James Hansen and Tom Karl over the last decade.”
As I recall it (and could be wrong) Tom Karl that started the whole thing and convinced Hansen the data needed “adjusting”.
Karl et al wrote a series of papers in the 80’s about biases in the temperature record. That seems to have set the ball rolling. (I’ll have to check the discussions in earlier papers, starting with Willett, 1950; they may say something about these issues.)
Here’s the paper that describes what they have done for v2. They got rid of SHAPS and UHI, and are just using TOBS, Filnet, and a “pairwise” algorithm.(What a meat grinder this is)
ftp://ftp.ncdc.noaa.gov/pub/data/ushcn/v2/monthly/menne-williams2009.pdf
USHCN site
http://www.ncdc.noaa.gov/oa/climate/research/ushcn/
Here’s a link to a blog post by Steve M on the adjustments from 2007. He has a link to the data set for the earlier v1. Should compare that with the raw and v2, if you are able.
http://climateaudit.org/2007/02/16/adjusting-ushcn-history/
Definitely looks like something fishy going on with your comparison of the raw and v2. I wonder if that adjustment graph is truly still valid since it ends in 1999. Could it be old v1 adjustments?
I do know that GISS grinds the adjusted data even more in the past.
You can see the difference using their own site. You can select GHCN v3 or GISS on the drop down for your temp chart.
http://data.giss.nasa.gov/gistemp/station_data/
From the beginning of the record of my hometown to about the early 60’s, GISS cools the record between 0.3 – 0.5C on an annual basis. From the late 60’s through the 80’s it’s 0.1 – 0.2C cooler. In the 90’s it’s 0.1C cooler. Starting in 2001, the record is the same as GHCN v3.
So, not only do you have the original HCN meat grinder, GISS works it even cooler up until recent past. This is really fraudulent stuff going on here.
So cheating is okay @ .6%.? I would think it isn’t okay @ any %.
I cannot make anything out of this unless provided with the error estimates to calculate a deviation from some averaged quantity.
This is really what makes NOAA and GISS studies so cruddy.
I recall wondering aloud about this very issue. Interesting. As it is, I think I understand the rationale for the earlier downward adjustments (whether valid or not), but not the later upward ones. Why would recent temperature readings need any adjustments at all? These readings were all made long after the shifts in time-of-observation and thermomenter type, which are the basis for the Karl et al. arguments of the ’80’s.
This is why they are continually stating that “It’s worse than we expected”!