Disrupting the Borg is expensive and time consuming!
Google Search
-
Recent Posts
- Gaslighting 1924
- “Why Do You Resist?”
- Climate Attribution Model
- Fact Checking NASA
- Fact Checking Grok
- Fact Checking The New York Times
- New Visitech Features
- Ice-Free Arctic By 2014
- Debt-Free US Treasury Forecast
- Analyzing Big City Crime (Part 2)
- Analyzing Big City Crime
- UK Migration Caused By Global Warming
- Climate Attribution In Greece
- “Brown: ’50 days to save world'”
- The Catastrophic Influence of Bovine Methane Emissions on Extraterrestrial Climate Patterns
- Posting On X
- Seventeen Years Of Fun
- The Importance Of Good Tools
- Temperature Shifts At Blue Hill, MA
- CO2²
- Time Of Observation Bias
- Climate Scamming For Profit
- Climate Scamming For Profit
- Back To The Future
- “records going back to 1961”
Recent Comments
- Bob G on Gaslighting 1924
- Bob G on Gaslighting 1924
- conrad ziefle on Gaslighting 1924
- Bob G on Gaslighting 1924
- Bob G on Gaslighting 1924
- arn on Gaslighting 1924
- conrad ziefle on Gaslighting 1924
- Gordon Vigurs on Gaslighting 1924
- conrad ziefle on Gaslighting 1924
- Robertvd on Gaslighting 1924
A Closer Look At The Jay Zwally 2012 Ice Free Arctic
This entry was posted in Uncategorized. Bookmark the permalink.


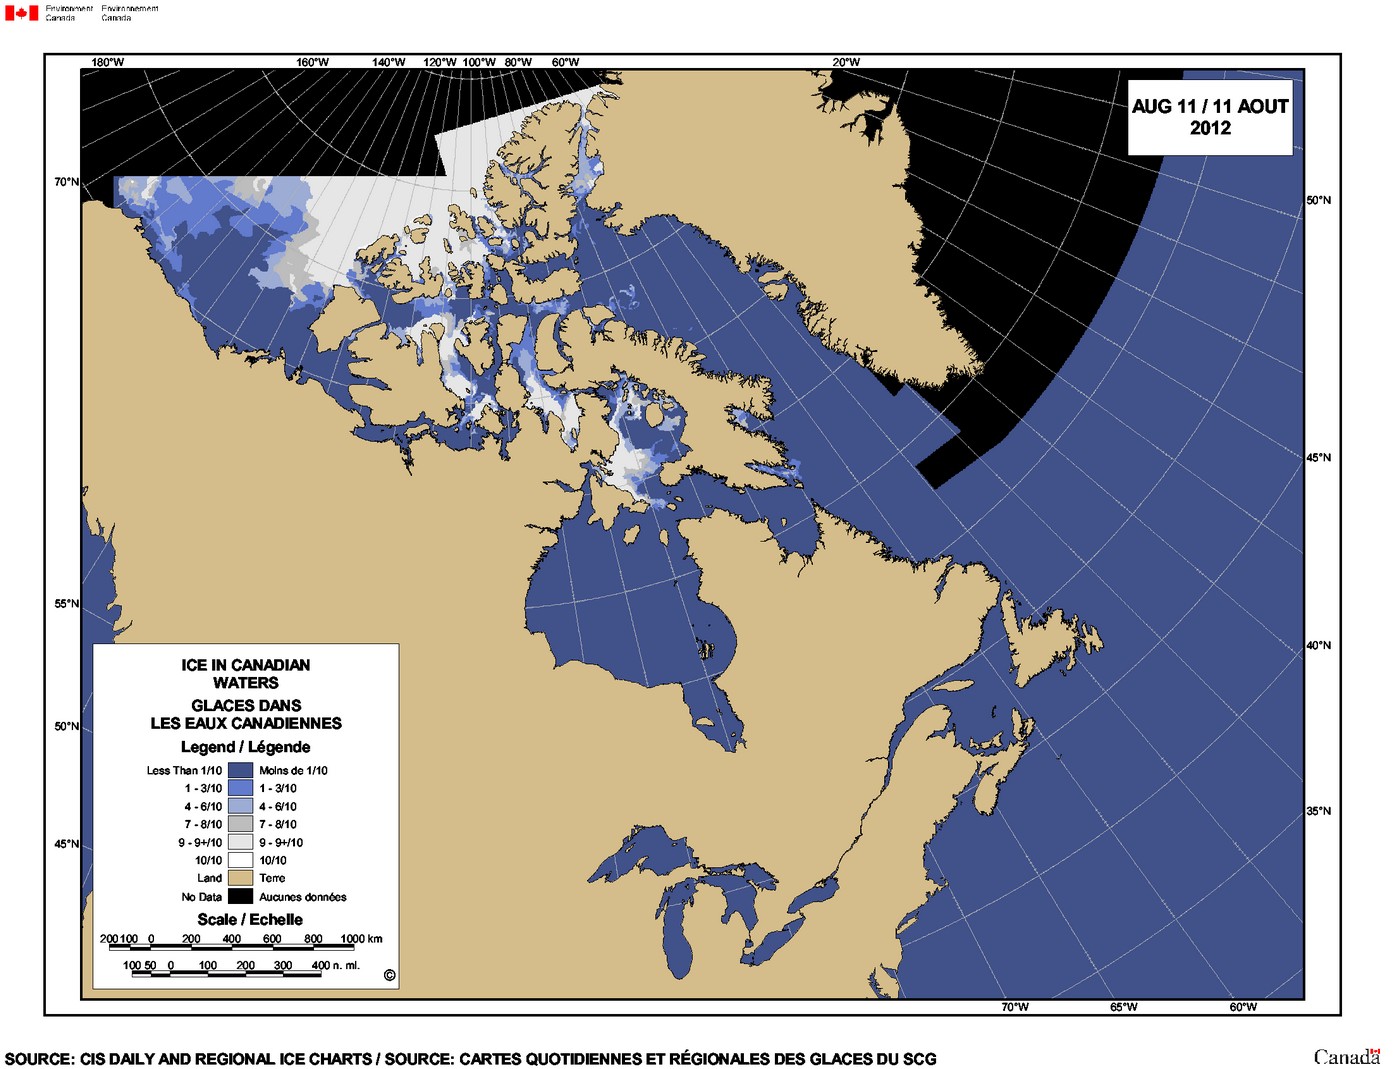
Here’s a couple ice charts from the Canadian Ice Service.
Chukchi Sea(part of it)
http://ice-glaces.ec.gc.ca/prods/WIS45CT/20120810180000_WIS45CT_0006587119.gif
The lower right of the above chart is the top center of this one for the Alaskan coast(part of it)
http://ice-glaces.ec.gc.ca/prods/WIS40CT/20120810180000_WIS40CT_0006587105.gif
Looks like 20-50% ice concentrations for these parts.
2012 already at a record low, and still heading down! 2 -3 wks to go.
http://www.iup.uni-bremen.de:8084/ssmis/extent_n_running_mean_regularF17.png
Jay Zwally