Disrupting the Borg is expensive and time consuming!
Google Search
-
Recent Posts
- Fact Checking NASA
- Fact Checking Grok
- Fact Checking The New York Times
- New Visitech Features
- Ice-Free Arctic By 2014
- Debt-Free US Treasury Forecast
- Analyzing Big City Crime (Part 2)
- Analyzing Big City Crime
- UK Migration Caused By Global Warming
- Climate Attribution In Greece
- “Brown: ’50 days to save world'”
- The Catastrophic Influence of Bovine Methane Emissions on Extraterrestrial Climate Patterns
- Posting On X
- Seventeen Years Of Fun
- The Importance Of Good Tools
- Temperature Shifts At Blue Hill, MA
- CO2²
- Time Of Observation Bias
- Climate Scamming For Profit
- Climate Scamming For Profit
- Back To The Future
- “records going back to 1961”
- Analyzing Rainfall At Asheville
- Historical Weather Analysis With Visitech
- “American Summers Are Starting to Feel Like Winter”
Recent Comments
- Bob G on Fact Checking NASA
- Bob G on Fact Checking NASA
- arn on Fact Checking NASA
- Gordon Vigurs on Fact Checking NASA
- Bob G on Fact Checking NASA
- Bob G on Fact Checking NASA
- arn on Fact Checking NASA
- conrad ziefle on Fact Checking NASA
- conrad ziefle on Fact Checking NASA
- arn on Fact Checking NASA
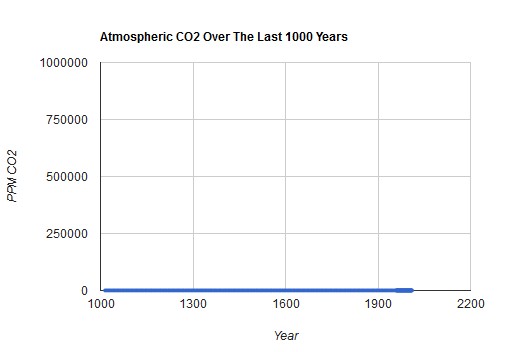
A Disturbing Trend In Atmospheric CO2
This entry was posted in Uncategorized. Bookmark the permalink.


LMAO … I’m sure your hilarious sense of humor will be lost on the alarmists. The adjustment of the graph’s scale to reflect the big picture is poignant.
I detect a thickening (doubling?) of pixels near the terminus of the plot…the end is near!
For a little dab of trace gas, CO2 goes a long, long way!
Always remember; it’s the beer gas!
Cool graph Steve. Made me chuckle. Climate alarmist statisticians use mind stretching voodoo tactics to meet the ‘Agenda’. These also make me chuckle.
OMG, CO2 levels are accelerating at an unprecedented rate!! /sarc
Why did the data get so noisy after 1950 (don’t tell me, they used tree-ring proxies after that, right)?
Is it at .04 % yet?
I’m a climate alarmist statistician and I found this hilarious