

Disrupting the Borg is expensive and time consuming!

Google Search
-
Recent Posts
- Bullseye!
- It’s Getting Closer
- Greenland Meltdown Scam
- Greenland Ice Update
- Wyoming Gold
- Three Years Since The Apocalypse
- Arctic Report card Summer 2026
- Elon Pushing Pushing Geoengineering
- Earth, Wind And Fire
- On The Road Again
- Vandalism At The Reflecting Pool
- Fifty Years Ago Today
- Truth Or Consequences
- US Climate Trend Maps
- Declining Spring Snow Cover In Northern New Mexico
- You Can’t Fool Mother Nature
- Cattle And The Climate
- One Atomic Bomb Per Hour
- New Video : Analyzing Oil And Gas
- Is Antarctica Melting?
- High Speed Analysis And Visualization
- El Nino To The Rescue?
- Fake News Update
- Growth Of Antarctic Sea Ice
- 65 Years Of Progress!
Recent Comments
- Stuart Hamish on Three Years Since The Apocalypse
- Stuart Hamish on Cattle And The Climate
- Stuart Hamish on Cattle And The Climate
- Stuart Hamish on Cattle And The Climate
- Bob G on Bullseye!
- conrad ziefle on Bullseye!
- arn on Greenland Ice Update
- D. Boss on Bullseye!
- D. Boss on Bullseye!
- scott allen on Bullseye!
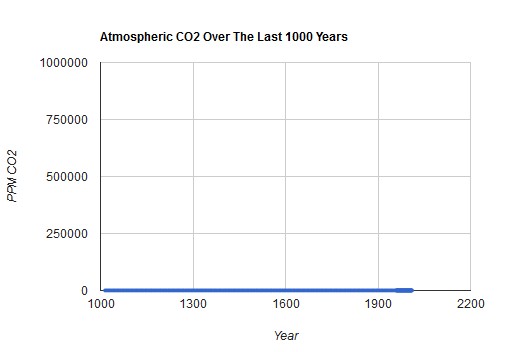
LMAO … I’m sure your hilarious sense of humor will be lost on the alarmists. The adjustment of the graph’s scale to reflect the big picture is poignant.
I detect a thickening (doubling?) of pixels near the terminus of the plot…the end is near!
For a little dab of trace gas, CO2 goes a long, long way!
Always remember; it’s the beer gas!
Cool graph Steve. Made me chuckle. Climate alarmist statisticians use mind stretching voodoo tactics to meet the ‘Agenda’. These also make me chuckle.
OMG, CO2 levels are accelerating at an unprecedented rate!! /sarc
Why did the data get so noisy after 1950 (don’t tell me, they used tree-ring proxies after that, right)?
Is it at .04 % yet?
I’m a climate alarmist statistician and I found this hilarious