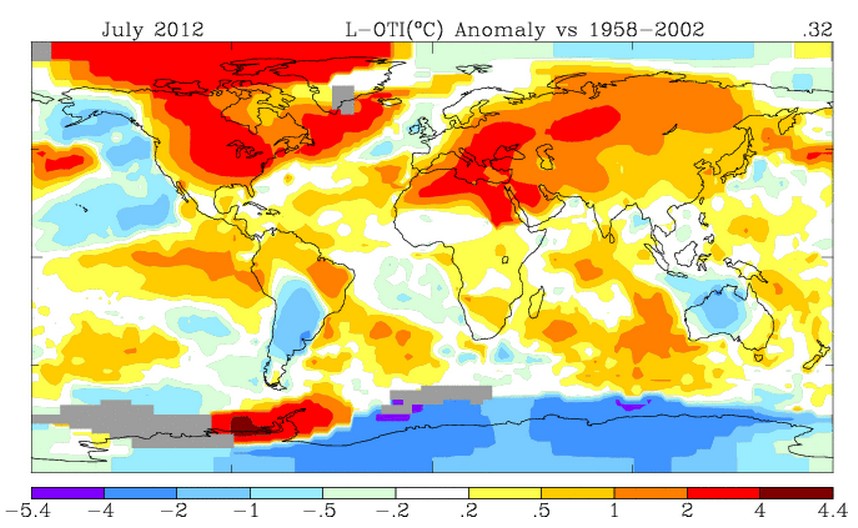
Hansen shows 2-4C anomalies near the North Pole, which are impossible in summer due to the latent heat of melting ice.
Data.GISS: GISS Surface Temperature Analysis
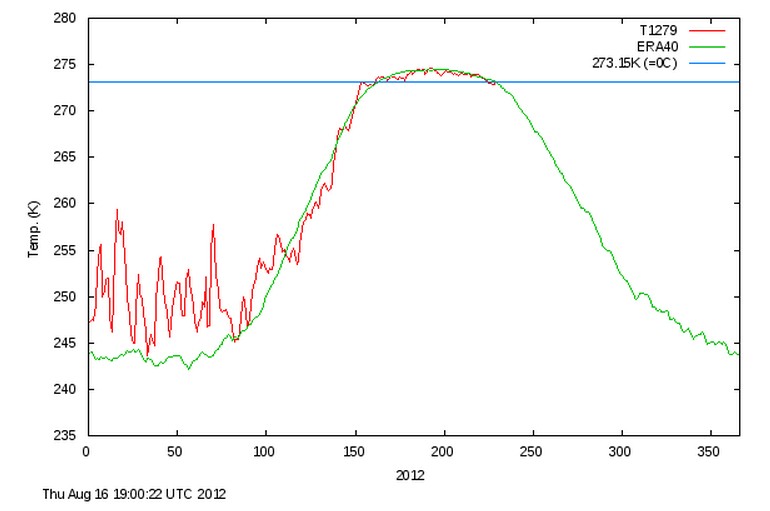
DMI shows that the whole month of July was normal or below, north of 80N
COI | Centre for Ocean and Ice | Danmarks Meteorologiske Institut
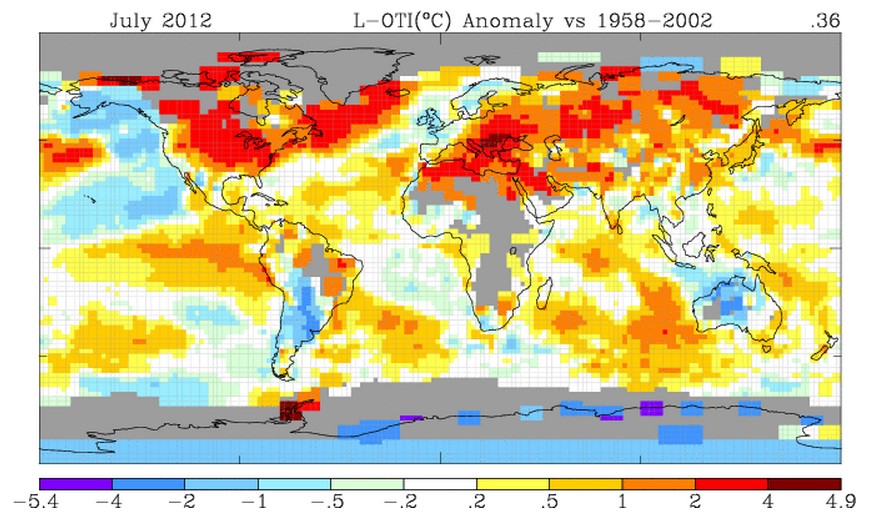
Hansen accomplished this stupidity by fabricating data where he doesn’t have any thermometers (grey area below.)
Data.GISS: GISS Surface Temperature Analysis
All this cheating, and still below scenario C.


Look at the JAMSTEC fall forecast…
http://www.jamstec.go.jp/frcgc/research/d1/iod/sintex_f1_forecast.html.en
Way cool over the most populous areas of the planet. It will be a great time to mock and humiliate Alarmist scum.
JAMSTEC’s summer forecast was too cool. The July forecast for autumn will very likely be too cool, as well. For starters, following a likely record low Arctic Sea Ice Extent minimum (JAXA), the Arctic will likely see a very warm fall. A warm source region for Arctic air masses means that the cold will be less severe and less expansive than would otherwise be the case. Not surprisingly, other guidance is warmer than JAMSTEC.
I don’t think Arctic Sea Ice Extent is nearly as important as the overall NH snowcover in the fall. While we’re running low attm, we could still see a rapid expansion of snowcover as we move into late September & October.
Click on “Surf air temp anomaly” for the parameter.
you mean India and Indonesia? (Most populous areas of the planet…)
It all depends on the baseline. Compared to 1998 to 2011, it’s cooling.
http://data.giss.nasa.gov/cgi-bin/gistemp/do_nmap.py?year_last=2012&month_last=7&sat=4&sst=1&type=anoms&mean_gen=07&year1=2012&year2=2012&base1=1998&base2=2011&radius=1200&pol=reg
(sorry, I was cherry picking. Central Europe and China should be in that list, too)
It is also always very warm biased over the South Pacific Ocean where there are probably few, if any reporting stations. Where there is land in the Southern Hemisphere, it was quite cold.
Dr. Hansen isn’t “creating” an temperature anomalies. The extrapolation is robust and its reasonably represents Arctic temperature trends. The incorrect characterization of the GISS temperature record has already been reviewed and dismissed. For a link: http://www.skepticalscience.com/dmi-data-on-arctic-temperatures-intermediate.html
The extrapolation is clearly not robust. Impossible and incorrect is not robust.
Skeptical science is a well funded alarmist site.
“The extrapolation is robust…”
“These are not the droids you’re looking for.” 😉
From a skeptic and scientist (Dr. Postma):
All in all, skeptics are fairly concerned that there is a fundamental conflict of interest that such “science” could never be trusted. It’s like giving the power to create money to the counterfeiters. It is also most telling that the only scientists who are the most alarmist appear to be those who benefit most from the political policy funded it. Yet, typically any other scientist from any other field becomes “a skeptic” when they take the time to review the actual data for themselves.
Nothing could be more clear: a scientifically literate person who doesn’t know any of the details of climate facts might support the alarmist cause, but once a scientifically literate person informs themselves of the actual science, they invariably become more skeptical. The only scientifically literate enclave still supporting alarmist climate science is the one paid to do so.
http://principia-scientific.org/supportnews/latest-news/145-postma-debunks-skeptical-science-greenhouse-gas-junk-defense
But it couldn’t be clearer: In the desert there is very little water vapour, and water vapour is the strongest heat-amplifying so-called greenhouse gas, especially considering it’s overwhelming radiative properties as compared to CO2. Yet in the desert, much higher temperatures are reached than are achieved at similar latitudes in areas where there is an abundance of water vapour. If the greenhouse effect was really in operation, regions with more water vapour in the air should get much hotter than regions without, yet the reverse is seen to be the case. It doesn’t get any simpler and clear cut than this: where there should be a stronger greenhouse effect, the opposite is what is actually found.
C12/C13 ratio
Various comments
Plants have preference for the “lighter” C12. If you would look at the total Carbon cycle, you would see that geological CO2 emissions have higher concentrations of C13. If you would attribute all increases in CO2 to the anthropogenic i.e. fossil origin C. The balance should change to C12 side. What it means: oceans and earth plants are able to deal with all anthropogenic CO2. What we have is geological outgassing that changing concentration of CO2 in the atmosphere.
I am suspicious of arguments which boil down to ‘we’ve looked at everything else so it must be…’ What they are really saying is ‘it must be if we haven’t forgotten something or something’s not yet been measured. The CO2 budget always looks like that to me — the C3/C4 versatility wasn’t even known when the Suess effect was confidently put forward as the great proof of anthropogenic CO2 rise.
As for the anthropogenic signal in the C13/C12 ratios there is one other thing to consider.
Since increased C02 is thought to increase plant biomass, and higher temperatures also are conducive to plant growth, it is entirely possible that the decreasing C13/C12 ratio is the result of increased decay of photosynthesizing organisms, which is secondary to increased productivity.
The above is from E.M. Smith.
http://chiefio.wordpress.com/
Other good comments. Not mine.
Global warming events – statistical chances
http://bit.ly/R669X3
So, instead, the “godfather of global warming” has essentially said, “Nope, we can’t figure out the puzzle because it’s too complex. But statistically this is so unusual that it must be man-made global warming.”
Rather than trying to prove something that cannot be scientifically proven (because there is no way to truly reproduce a test condition), they have taken to analyzing the issue statistically. They assign what they consider to be reasonable odds for various events taking place, and then use statistics to calculate the probability that those things could have all happened to produce the species we see around us.
“The weakness is that statistical associations are not reliable indicators of causality.”
“The biosphere, even with all its marvels, as far as is now known very probably can be a simple accident; we mortals have no reason to reject such a presumption”
But, regardless, what we can conclude is that global warming “science” is dead. They’ve given up on fudge-factor-filled climate models. They’ve given up trying to scientifically explain how it’s really possible for humans to have the impact they say we have on the climate. They’ve simply given up. Instead, they want us to trust their statistics.
Global warming has been dying a slow death for years. But global warming is now dead.
And, ironically, it was killed by the arguments liberals use against Intelligent Design.
This is from Ian Plimer, the climate realist from Australia:
Ian Plimer – CO2 volume
“Someone whom I was delighted to meet again in Australia was Professor Ian Plimer, a prominent “climate sceptic”, who is one of Abbott’s advisers. In his latest entertaining book, How To Get Expelled From School (by asking the teachers 101 awkward scientific questions about their belief in global warming), Plimer cites a vivid illustration of how great is the threat posed to the planet by man-made CO2.
“If one imagines a length of the Earth’s atmosphere one kilometre long, 780 metres of this are made up of nitrogen, 210 are oxygen and 10 metres are water vapour (the largest greenhouse gas). Just 0.38 of a metre is carbon dioxide, to which human emissions contribute one millimetre.”
It’s because they can’t tax and make billions off of everything else so it’s has to be something we humans done.