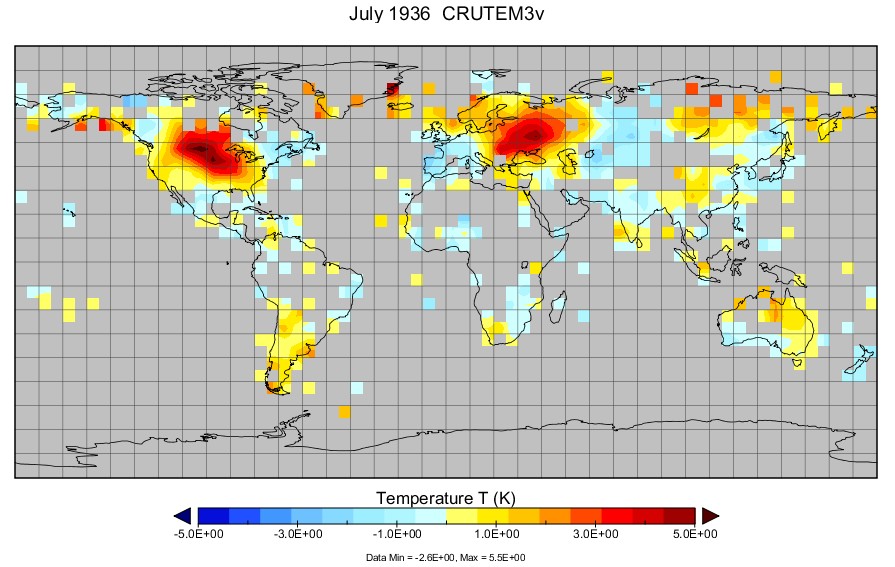
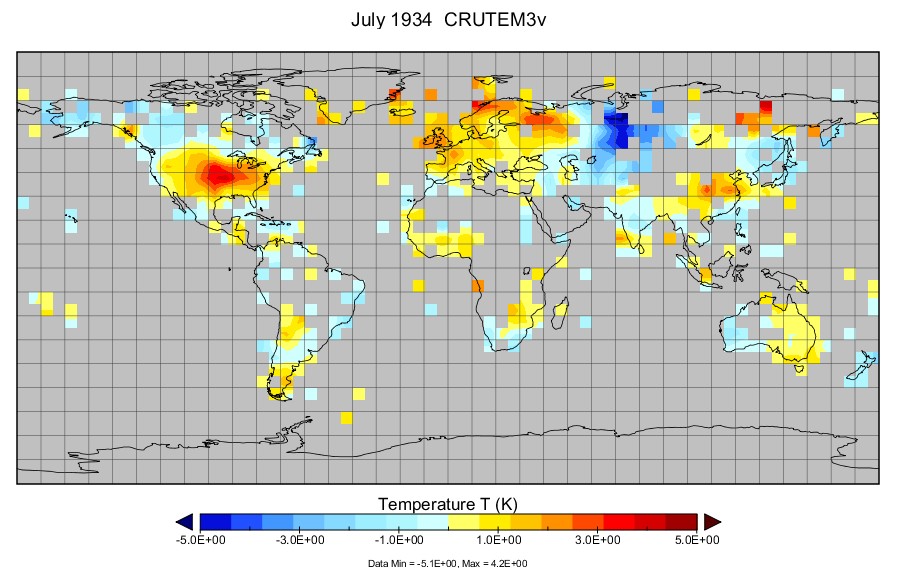
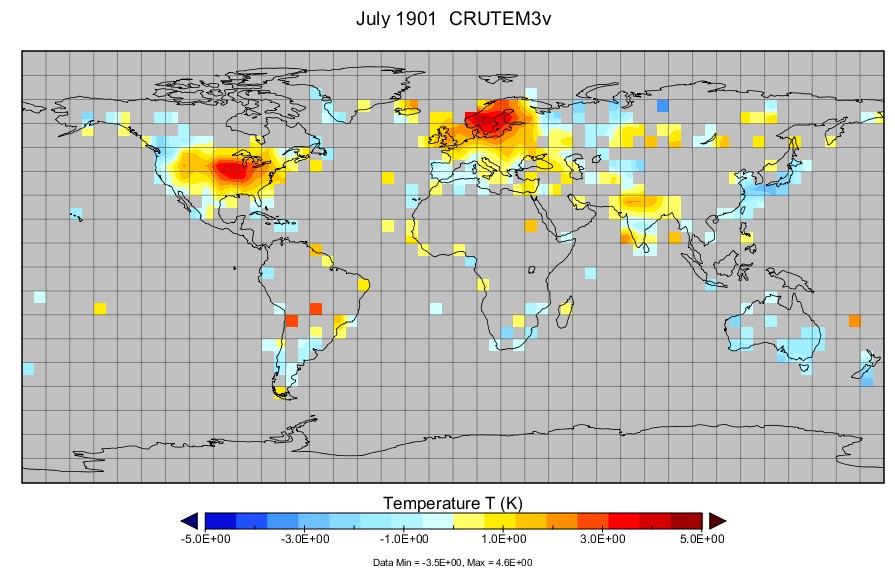
Hansen claims that heatwaves used to be much less extensive.
The percentage of the earth’s land surface covered by extreme heat in the summer has soared in recent decades, from less than 1 percent in the years before 1980 to as much as 13 percent in recent years, according to a new scientific paper.
Extreme Heat Is Covering More of the Earth, a Study Says – NYTimes.com
He has absolutely no idea what he is talking about. Historical US heatwaves correlate well with heatwaves at other parts of the planet, and covered much more than one percent of the land surface . Nothing has changed, except inside his troubled mind.


All of those have heatwaves on about 2% of the planets surface. It could be 1.5% if I could do the math or had a way to do the math. In 1936, that’s 1/2 of the US (1%) and half of Europe (less than 1%), so there you go. In each one you’re looking at 2 or _maybe_ 3% of the Earth’s surface covered in heatwaves.
You’re also not going to see heatwaves over the ocean like you will on land, so even if there was a heatwave in every country on Earth, it would only be 30% of the Earth’s surface.
You appear to be severely math challenged
Steve, what you have done very well is to demonstrate that heatwaves, both past and present are a response to a weather pattern and have nothing to do with “climate change”. Those maps are so similar, it is amazing. Same cold systems, same warm systems in more or less the same places. Same in 1901 as 2012, but worse in 1901.
It’s you who is math challenged. To find out the extent of a ‘heat wave’ globally, you need to do an integration to find the total area (and extrapolated ‘volume’ to weight anomalies) versus the surface of the earth. You can’t simply eyeball a picture and say how much of the Earth is covered in a heat wave. Also, I guarantee you Hansen used better data than what you did – and from multiple sources. He probably did the integration calculation, too.
You are completely clueless. Read what Hansen said :
By JUSTIN GILLIS
Published: August 6, 2012
http://www.nytimes.com/2012/08/07/science/earth/extreme-heat-is-covering-more-of-the-earth-a-study-says.html?_r=4&ref=science
So, do the math for heatwaves of recent years. Judging by your data, Hansen was right about his assessment of heatwaves in the past.
You must be completely daft.
You are such a dishonest person.
1) Hansen used a baseline of 1951 to 1980.
2) Hansen didn’t use exclusive CRUTEM3v data. He used GHCNv2.
3) Your maps are not only incomplete (conclusions can’t be drawn) but it isn’t within his baseline or analysis.
4) He calculated the area of places with >=3 standard deviations.
5) According to the maps he posted (which agrees with GISS data) he is correct that the scope of heat waves HAS increased
Why didn’t you link to the actual paper instead?
http://www.pnas.org/content/early/2012/07/30/1205276109.full.pdf+html
Why didn’t you use the data he was using? It seems like you just cherry picked data you thought looked good to you even though it’s woefully incompletely and doesn’t even show what baseline it’s using.
He didn’t even use GHCNv3 which has warmer data. In other words, he was being conservative. He didn’t even include ocean area due to the possibility of error in the 1950-1981 baseline.
The paper looks sound to me, and actually is slightly conservative.
You are an idiot. A heatwave is a heatwave. temperature is temperature.
A 0.2 degree difference in baseline isn’t going to have much effect on a +5C anomaly. Are you really stupid enough to suggest that CRU and GHCN differ by several degrees?
Go shove it. You are getting really annoying with your crap.
Daft?
Either you read the paper and didn’t understand it, or you read it and you chose to lie about it, or you didn’t read it at all.
What the paper says and what you are saying are separate things.
I don’t write for the New York Times, dumbass.
Also, it’s clear Hansen didn’t say heat waves were only in one spot of the planet. He said they only effected 1.5% of the Earth’s surface at any given time. You’re saying he said something he did not say.
The only difference between recent heatwaves and 1930s heatwaves is that the older ones were hotter.
Hotter compared to what? It takes more than extreme temperatures on any given day to say a heat wave was better or worse. You have to look at coverage over time, and averages over time.
You are the king at cherry picking data.
You are exactly right . You have to look at coverage over time and averages over time and the 1930s certainly trump the present . And the 1950s had some pretty dry times . So this year parts of the country have been hit with a bit of heat and drought and you alarmists , since the co2 scam isn’t working out for you , are trying to spin it as though it is climate change catastrophe . Now about that co2 , why aren’t we seeing real record heat with the co2 rising continually ? You alarmists are massaging the data like theres no tommorrow in an attempt to snow people with your lie that the climate is going out of control . Anthony Watts recently put up an excellent post on the new temp measuring system put in place by the government that you alarmists are avoiding using because you can’t spin it or adjust it to tell the story you want. It is the USCRN data and it has been running four years and the 2012 July average comes to 75.55 which is well below the 77.7 you scammers are claiming . I say uhi and poor station sighting is what gives you guys your warming , and of course hansen and cohorts manipulation of the data. As far as hansens claim about percentages of land surface covered by heat and drought , I think he has manipulated the data he deals with to the point that he doesn’t know what reality is.
The only differences between this Al ‘D’ Gore and ‘Global Warming’ effort to extort money from third world for the British royals and Rasputin are the long beard and a wool pullover. i am so glad of my freedom to do research and consult the pros. Not so for Al ‘D’ Gore.
Hansen should take note, like millions of curious minds have, of the effects of certain HAARP weather attacks on local and cumulatively, on global weather aberrations. Enough information exists to enable a large crew of unemployed structural engineers and workers just cause in a court’s order to dismantle ALL of the HAARP facilities because of the damage done world wide and the damage to the atmosphere and ionosphere. I will be there with a case of beer and a sledge hammer with an offer of free labor to get rid of the things. I want to see Al ‘D’ Gore out of a job. Hansen too. Hansen needs to know that he can give up all that and still pay off his mortgage, unless he has gambling debts at casinos in British protectorates. Not so the British royals. 10XGDP in debt. They have their names on everything on planet earth that they have been able to claim, at gunpoint AND everywhere they could without being taken seriously. This Hansen is really stretching it with his baseless claim of ‘uber alles’ logic as the only true logic, Much like the pope and his nonsense and the queen lizard and hers. Hint. Hint.
The Brit royal press corps has been emphasizing the use of an old specialty lens used for photographing ‘dignitaries’ because its distortion is that it greatly increases the size of the subjects’ heads without photoshop or layering or other darkroom technique. There are MANY published examples of this lens’ use. My great uncle received a patent for eliminating this distortion in a simple demonstration at the patent office back in the 1930s. He just replaced a distorted lens with standard one to produce a correction of a distorted image used for an uncopyrighted shot. The big guys bought him out. Uncle did O.K..
The perpetual heat/drought is temporarily over in New Mexico, got torrential rainstorm tonight around Albuquerque. Temps in East mountains down to low 60s.
anyone that copies a name and interposes letters can only be up to no good. and would clearly be uninterested in science.
RAIN? After a drought? who would have guessed? Not Hansen. Watch the knuckle heads over at HAARP cause all sorts of radical weather vents to game the ‘weather futures ‘ market and for carpetbagging weather distressed farmland. Follow actual HAARP circle concentrations and the guaranteed weather event 24 to 48 hours later at dutchsinse.com. I watched him monitor and predict three HAARP created weather events in a row. He still does it using the government’s own weather satellite feeds. We need to turn up the heat on the wall flower population in front of the Goddamned CFRtv and get them helping to cleanse the country of these group fool pirates destroying and killing across America. Fukushima, 9-11, HAARP, DH oil well blowout, etc. were all carried out by the same central authority. The Holder is a tool.
Stoddard, the paper ignores the oceans and only talks about land percentages. “The percentage of the earth’s LAND SURFACE covered by extreme heat in the summer has soared in recent decades, from less than 1 percent in the years before 1980 to as much as 13 percent in recent years, according to a new scientific paper.
I’ve come to learn that people like “Stoddard” are not concerned with explanations that make sense.
The only thing overheating on this planet is Hansen’s inflated ego. Even if the earth were experiencing more heat waves, there’s no proof it is caused by human CO2 emissions. There is absolutely no concrete link between man-made CO2 and so-called global warming, which ceased 15 years ago. It’s a fiction invented by a few greedy scientists supported by a group of filthy rich investment bankers who want to scam the public by setting up a global carbon exchange.