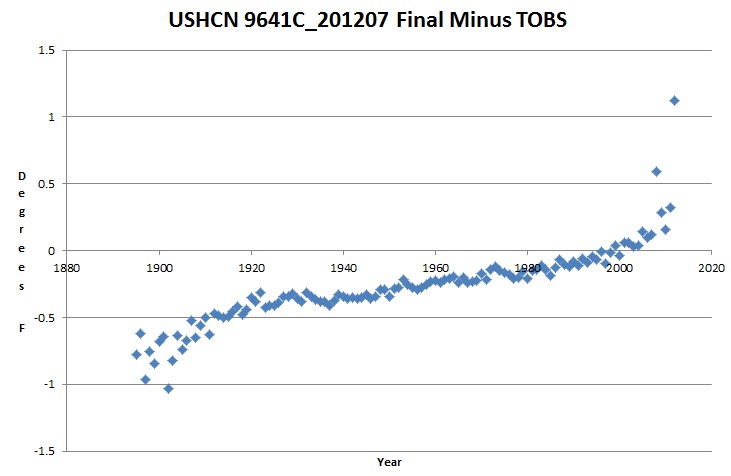
The graph below shows last month’s version of USHCN final minus TOBS.
TOBS itself is completely out of control, but what is this additional steadily increasing two degree adjustment about?
It is not documented by USHCN, which only admits another 0.2F above TOBS. Whatever this adjustment is, it is 1000% above what they are documenting.


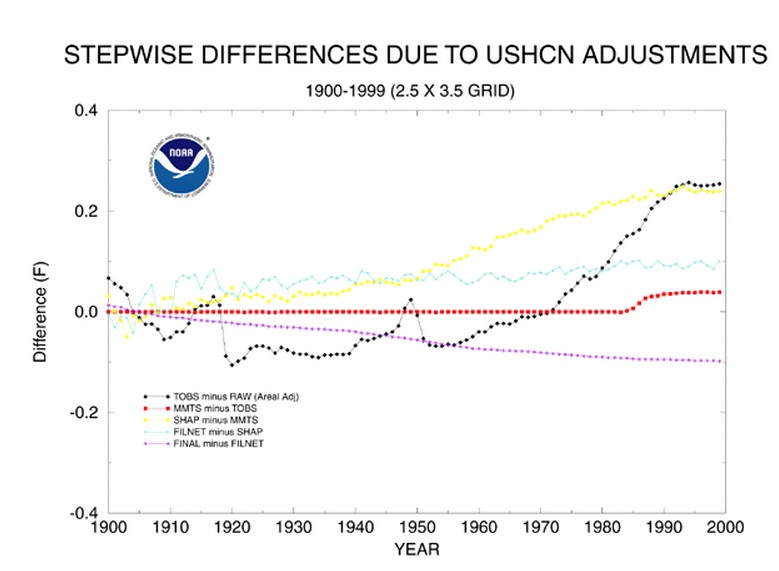
Look at the yellow line (SHAP minus MMTS). This seems to account for this extra adjustment. Technical details are here:
http://journals.ametsoc.org/doi/pdf/10.1175/1520-0450%281987%29026%3C1744%3AAATACT%3E2.0.CO%3B2
I’ve only skimmed it, but it seems to be a nearest-neighbour method of re-calibrating each station each time there’s a documented change other than the already-corrected-for TOBS and MMTS changes. Most of these additional changes are station moves.
Oh hang on, just clocked the scale on the second graph. Doesn’t account for it all (though note that the first graph only shows up to 1999, so isn’t easily comparable to the second).
http://stevengoddard.files.wordpress.com/2012/08/screenhunter_152-aug-06-23-59.jpg
I think you already exposed the TOBS fraud earlier by showing that raw rural minimum temps have been steadily rising, opposite of what TOBS bias should show. Check out this bit of lunacy from the woeful ‘skepticalscience’ blog:
“There is practically no time of observation bias in urban-based stations which have taken their measurements punctually always at the same time, while in the rural stations the times of observation have changed. The change has usually happened from the afternoon to the morning. This causes a cooling bias in the data of the rural stations. Therefore one must correct for the time of observation bias before one tries to determine the effect of the urban heat island”
So we are to believe that city folks are smart enough to wait till the end of the day whereas rural folks are stupid hicks who after years of doing it the right way all of a sudden lost 40 IQ points and thought it would be a good idea to take high/low readings long before the heat of the day? Yeah, sure.
I’ll wager that anyone at NCDC who suggested a series of adjustments that resulted in the lowering of overall temperatures during the 1900 – 1999 period would be looking for another job.
Global warming is and always has been about money and power. It is a political creation. Politicians and scientist enablers like James Hansen early on fingered CO2 as the “perfect bad guy” that could be used to generate huge sums of money in the form of taxes, carbon offsets, alternative energies and research grants. Global elitists saw it as way to control economies and people.
Notice that the alarmists did not identify water vapor, which consititutes 98 percent of the so-called greenhouse effect, as the cause of global warming. Why? Because water vapor can’t be blamed on humans and therefore can’t be taxed. The alarmists couldn’t blame methane or nitrous oxide because the levels in the atmosphere are minuscule (which also is true of CO2, which constitutes 0.04% of the atmosphere).
CO2 turned out to be the perfect fall guy. Then all that remained was to invent an imaginary energy budget that showed CO2 capturing low-wave infrared and re-radiating it towards to the earth’s surface in the form of more heat energy. This energy model was captured in a pictoral representation, courtesy of Kenneth Trenberth, that is the foundation of the global warming myth. It was all very clever scientific legerdemain that managed to ignore the important role of conduction, evaporation, convection and precipitation in heat transport.
Should be long-wave not “low-wave” infrared.
A few facts about CO2:
CO2 constitutes approximately 0.04% of the atmosphere.
Only 2.75 percent of atmospheric CO2 is anthropogenic in origin. Mankind is responsible for just 0.001 percent of the total atmosphere.
If the atmosphere was a 100-story building, our anthropogenic CO2 contribution today would be equivalent to the linoleum on the first floor.
The U.S. portion of human CO2 is somewhere in the neigborhood of 0.00033%.
Note: According to meteorologist Joe D’Aleo: The amount of CO2 emitted is said to be up from 1 percent a decade ago. Despite the increase in emissions, the rate of change of atmospheric carbon dioxide at Mauna Loa remains the same as the long-term average (plus 0.45 percent per year).
Reblogged this on Climate Ponderings.
Anyone who measures the temp once a day should do so at the normal time of 7 AM with a standard max min thermometer. Any person who would take one daily measuement in the mid afternoon is a total moron. I bet very, very few did.
Actually, 7AM is just as bad as mid afternoon. That makes temperatures too low.