July average tops U.S. temperature record, NOAA says
The July heat wave that wilted crops, shriveled rivers and fueled wildfires officially went into the books Wednesday as the hottest single month on record for the continental United States.The average temperature across the Lower 48 was 77.6 degrees Fahrenheit, 3.3 degrees above the 20th-century average, the National Oceanographic and Atmospheric Administration reported. That edged out the previous high mark, set in 1936, by two-tenths of a degree, NOAA said.
U.S. forecasters started keeping records in 1895. The seven months of 2012 to date are the warmest of any year on record and were drier than average as well, NOAA said.
July average tops U.S. temperature record, NOAA says – This Just In – CNN.com Blogs
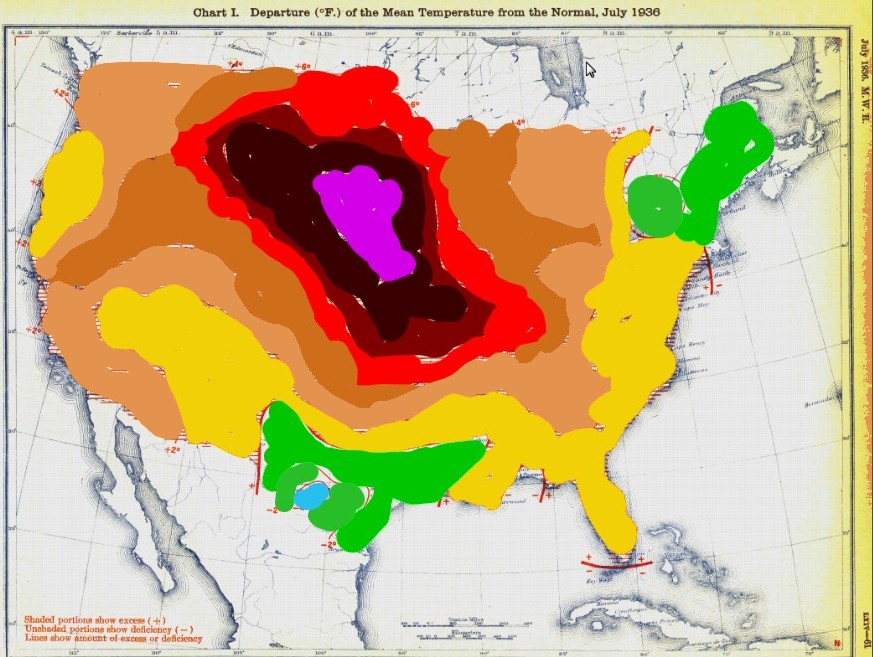
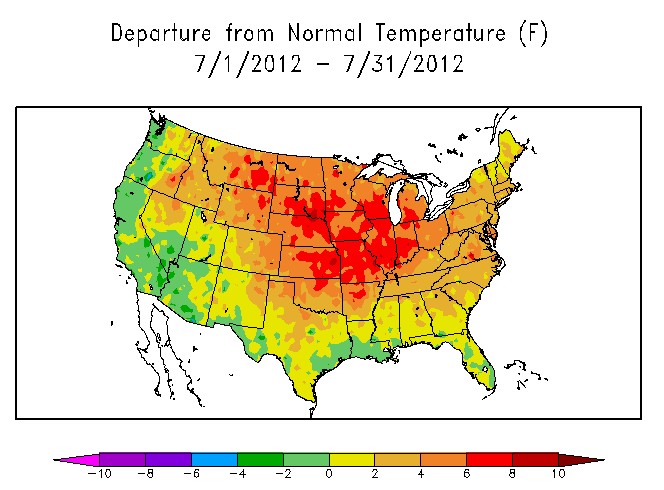
Complete nonsense. July 1936 was much hotter. Compare the two maps below – it isn’t even close.
docs.lib.noaa.gov/rescue/mwr/064/mwr-064-07-c1.pdf
The two maps don’t have the same baseline. We know that the second map has a 1981-2010 baseline, which averaged 74.4 degrees. If we guess 1900-1935 for the first map, the baseline was slightly higher at 74.5 degrees. That makes the fraud even worse.


There are some excellent historical photographs running on the below web site currently that document the human plight and migration associated with the 30’s drought and dust bowl. Some of the pictures would be a great accompaniment to your data and newspaper clippings. Not sure if they are copyrighted.
shorpy.com
Reblogged this on Climate Ponderings.
It was 121 in North Dakota in 1936 Major stations in Iowa and Illinois even in Michigan and Wisconsin were 111-114. Three straight days of 106 in Toronto. 112 in West Virginia.
Oakland, MD at 3000 feet, which rarely breaks 90 was over 100 in 1936. To say 2012 is even in the same ballpark is ridiculous.
Let them lie and say this July was the hottest. Every July from now on is certain to be colder, proof that man-made Gorebull warming is a myth.
It doesn’t work that way. They are adding on to their adjustments exponentially every year and will continue to claim warming until they report above the boiling point of water.
For the second Departure from Normal image Normal refers to the 1981-2010 Climate Normal.
What Climate Normal period is used for the first image? I assume it’s not the 1981-2010 Climate Normal.
Hard to say, but if you look at the US temperature data – the baselines can’t be more than a few tenths of a degree difference, which would hardly make dent in the five or six degree difference in the midwest.
I tried to leave a comment on the record july temp article at the daily mail uk site , but they would not accept comment on their biased idiotic article . They print their propaganda and then will not accept correction . Oh well , their reputation isn’t any good to begin with . I suppose in the night they will come up with a bunch of warmist comments from where the sun don’t shine and post them . You see warmists allowed to post at almost all the skeptic sites , and post with out any deletions or dropped statements . But warmist sites will not accept intelligent comment from the side that speaks the truth . Truth is anathema to the warmist mind , they fear it and never speak it .
I was visiting San Bernadino (over from the UK) approx 8 years ago, and experienced a 120degF (48(.8)degC) day then (measured by a car thermometer, so perhaps not the most accurate), so hot days are nothing unusual. Agree the evidence for the 1930s being hotter for longer should not be ignored by those that keep saying “since records began”, meaning at some convenient time after the 30s.