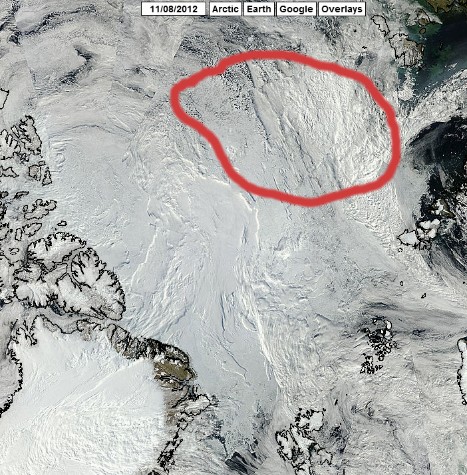
In order for 2012 extent to match 2007, essentially all of the ice inside the red circle has to disappear. It isn’t likely to melt, and the only thing which could cause this to happen would be very strong winds pushing the ice towards the North Pole, like in 2007. That is always a possibility, as obviously it has happened before.
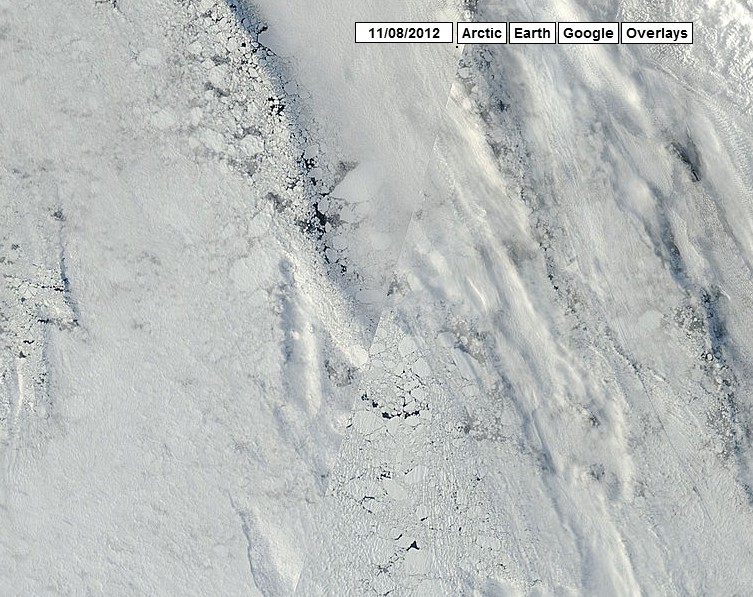
There is a lot of multi-year ice inside that circle (see closeup below) and temperatures are pretty much stuck near or below 0C for the indefinite future.
//ARCTIC.IO/OBSERVATIONS/8/2012-08-11/8-N84.294028-E169.268762


MYI in that region?
http://polarbear.colorado.edu/IceAge.html
maybe you should specify lat lons for your circle.. it would help
Hey Mosh, I’m a bit confused about your link. The graphic is dated 2010.
If he specifies his lat lons dont worry… .. think of it as a hint to steve that the information to test his claim is out there..
It is the Arctic
That ends in December of 2010 so it is not valid for this discussion.. MYI can be anywhere, it depends on the wind and current patterns this year. One thing that has not happened is the extreme loss due to ice drifting out of the region to melt at lower latitudes. Most of the loss we have seen recently is due to compaction, rather than melt.
its pretty simple. their is a 2011 chart and there will be a 2012 chart. What I am sugesting is that steven put down what the latitude and longitude of his circle is so that we can check the claim when the data becomes available. you know.. science.
if he tells us the lat/lon we might even be able to get him a clear view from modis in a day or two.. you know check his claims.. science.
Computer outputs are always very clear. 😉
As I said, what you provided was a computer fabrication of ice conditions.
Steve,
WOW, are you saying it is really possible there could be a new record low minimum extent?
You post so many times I must have missed all the other ones where you acknowledge this. What was you prediction for minimum extent this year, I forget? I know mine was 4.9 Mil Km2. Looks like I will be way off. Unless of course the melt season is almost over as you have repeatedly implied and/or stated. Still I think my updated 4.4 million is a reasonable one.
And posting a photo showing the multi year ice is so much clearer than that confusing color graphic Mosher posted.
Tony Duncan:
Your memory is in serious trouble. Most every post about ice conditions has the same line in it about wind conditions and their effect on the ice.
The link that MOSH provided is to a computer aided graphic of fabricated ice conditions based on satellite images. It is a what if scenario because MYI, or any ice for that matter, does not come in the colors of the rainbow and change like a kaleidoscope as time passes.
Wow, you continue to be an idiot.
What a thoughtful and constructive post. Why don’t you show how he is wrong instead of just calling him a name?
That would be the content of this post titled “The 2012 Problem For Arctic Alarmists”
I’m not sure that arctic alarmists have that much of a problem:
http://www.iup.uni-bremen.de:8084/ssmis/extent_n_running_mean_previous.png
OTOH, Steven has a busy couple of months coming up. A sneak preview:
http://hot-topic.co.nz/arctic-sea-ice-forecast-its-going-to-be-tough-to-stay-cool/
Why don`t you wait a few weeks to get neurotic and see what actually happens, Mr. henny penny
Looks like plenty of fresh, white snowcover over much of the rather large icecap. That, plus pools of unusually cold air rotating around the Arctic Basin should ensure very little melt during the foreseeable future.
yes. but from here on out its 3 factors at play
1. Bottom melt
2. compaction
3. transport
With the extent at around 5 million and area at 3 million. even goddard can understand that compaction alone can get you an addition 2M off of extent.
If this year finishes “normally” the records will be broken. If it finishes abnormally the records wont be broken. Either way, this year the arctuc will do something it hasnt done in recorded calibrated history.
It’s easy. compare the normal melt from this day out in every other year.
That is from day 224 forward, what kind of melts have we seen.
in the past 30 years.. anywhere from 400K to 1.3M loss in area.
Today, we stand 195K from the Area record. Recent history says to expect between
400K and 1.3M.. the only way we DONT set a record ( a new abnormal) is by having an abnormal amount of melt ( less than 195K ) either way. you’ll see something out of the ordinary
this year. either an out of the ordinary amount of ice ( less than 2.9M) Or an out of the ordinary slowdown at season’s end (less than 195K in the last 4 weeks)
At the current rate of loss, we break the record in 4 days. but something out of the ordinary could happen.
http://iwantsomeproof.com/extimg/sia_7.png
Well, that region is about 1 million km², right? Here’s today’s zoom http://www.arctic.io/zoom/pD68/0.6448825;0.4378924;5.9380713 , it’s getting thinner and thinner. every day. And since when does bottom melting care about snow?