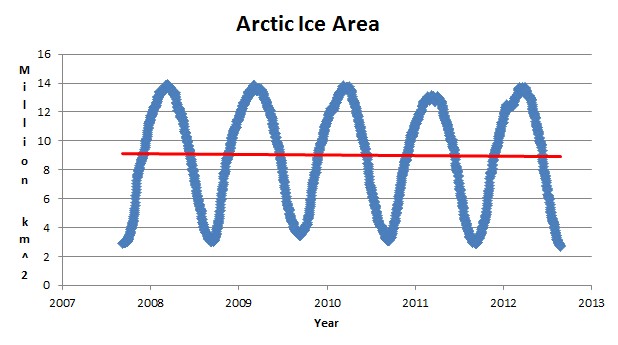
In 2007, our friends went hysterical and told us that the Arctic would be ice free by 2008, 2010, 2012 or 2013. Since then, nothing has changed.
Disrupting the Borg is expensive and time consuming!
Google Search
-
Recent Posts
- “Why Do You Resist?”
- Climate Attribution Model
- Fact Checking NASA
- Fact Checking Grok
- Fact Checking The New York Times
- New Visitech Features
- Ice-Free Arctic By 2014
- Debt-Free US Treasury Forecast
- Analyzing Big City Crime (Part 2)
- Analyzing Big City Crime
- UK Migration Caused By Global Warming
- Climate Attribution In Greece
- “Brown: ’50 days to save world'”
- The Catastrophic Influence of Bovine Methane Emissions on Extraterrestrial Climate Patterns
- Posting On X
- Seventeen Years Of Fun
- The Importance Of Good Tools
- Temperature Shifts At Blue Hill, MA
- CO2²
- Time Of Observation Bias
- Climate Scamming For Profit
- Climate Scamming For Profit
- Back To The Future
- “records going back to 1961”
- Analyzing Rainfall At Asheville
Recent Comments
- Bob G on Climate Attribution Model
- Bob G on Climate Attribution Model
- Bob G on Fact Checking NASA
- arn on Climate Attribution Model
- Bob G on Climate Attribution Model
- Bob G on Climate Attribution Model
- Bob G on “Why Do You Resist?”
- Gerald Machnee on Fact Checking The New York Times
- Gerald Machnee on Climate Attribution Model
- Gerald Machnee on “Why Do You Resist?”


In a couple of weeks we can put Arctic angel on pinhead counting to bed for this year.
No replies from the woe is the arctic crowd here?
He he he……
Nice use of a fat blue crayon.
What a moron
Oh Steve, Steve, Steve. That’s not very nice. I’m curious. Do you have any references for these scientists who claimed the Arctic would be ice free by those years? Also, since you downloaded data from 1979 to produce your fuzzy graph, why did you cherrypick from 2007? Why not plot all of it? Doing so would still support the takedown of your strawman.
I’m tired of morons.
I’ll take it that you don’t have any references then? Thanks for that admission.
So why have you only graphed the last few years? Would the last few decades support your beliefs? Is the red line plotted from the actual data or have you just plonked it on?
Are your reading and logic skills as poor as you pretend?