1979-2012
arctic.atmos.uiuc.edu/cryosphere/timeseries.anom.1979-2008
arctic.atmos.uiuc.edu/cryosphere/timeseries.south.anom.1979-2008
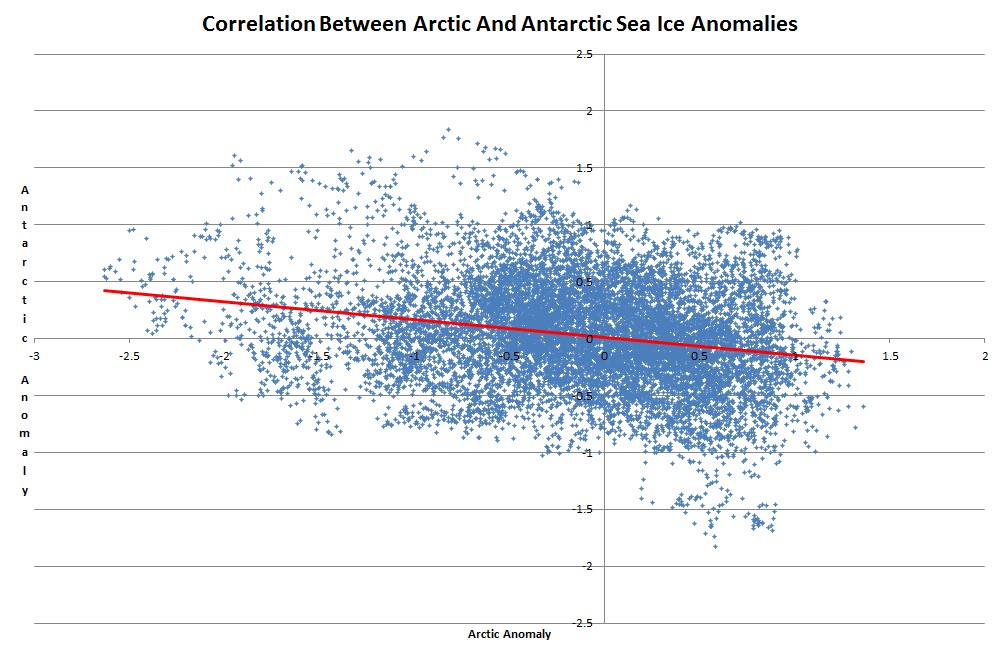
When Arctic ice is strongly negative, Antarctic ice is strongly positive, and vice-versa. r² = 0.05
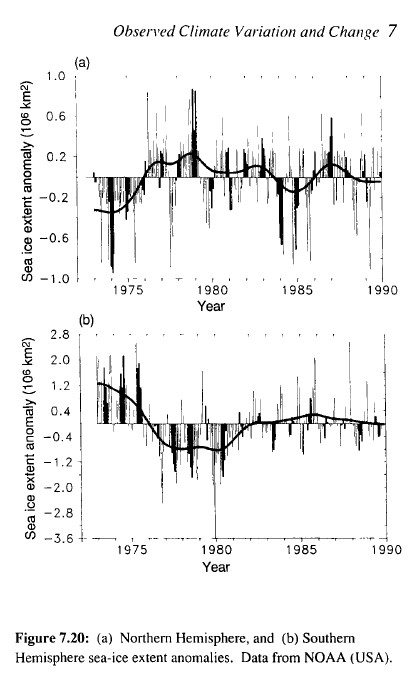
There is also a very good correlation before 1979


Wow.
Vostok Weather at a Glance
Weather Station
Vostok
Elevation
11220 ft
Station Select
Now
Clear
Clear
Temperature
-118 °F
Feels Like -118 °F
Wind(mph)
Must be Man ‘s fault! err something.
Image that…a natural cycle. On this planet? With people on it? Blasphemy.
She;s a witch! 😆
Proposed mechanism?
CO2. /sarc
Scientists refused to believe the obvious about continental drift for 70 years, because they didn’t understand the mechanism. Arrogance is the death of science.
Enjoyable reading…
http://en.wikipedia.org/wiki/J_Harlen_Bretz
Proposed mechanism? Ha! well, don’t we all ready have one, you know the one with an anthropogenic theme to it!
That make’s sense I think the southern hemisphere cools before the northern hemisphere, I read some where it has done this in the past.
Also isn’t this the time of year when AGW alarmists go into hibernation and we get hammered by colder winters, some countries last year had heavy direct fatalities especially in Europe. It’s disgusting! Oh, and apparently winter has come early for Iceland, reports are saying there is “extended blackouts” and thousands of sheep are in need of being rescued, it has to be having an effect on people there but it doesn’t say . have a look! Watch the video of sheep being rescued after these blizzards. Well done!
http://translate.google.com/translate?depth=1&hl=en&rurl=translate.google.com&sl=it&tl=en&u=http://www.meteoweb.eu/2012/09/e-gia-inverno-in-islanda-tormente-di-neve-e-blackout-in-tutta-la-regione-migliaia-di-pecore-ancora-sepolte/152965/
🙂
Update on that last comment, apparently “it remains a state of emergency issued Wednesday by the National Commissioner of the Icelandic Civil Protection Department for the District of Þingeyjarsýsla, in northern Iceland.”
Man made global warming is a strange beast after all isn’t it!
I believe the actual correlation is higher. The problem is, the Arctic is a closed ocean so there’s only so much space for the sea ice to (dis)appear. Some areas freeze 100% and melt 100% at which points their “anomaly” goes to zero. You can see this by the absence of dots in the upper left and lower right parts of the diagram.
Forgot ‘notify’
The correlation maybe higher, and I agree with what your saying, The point of interest here is, Steven has produced a chart correlating an overall cooling trend, and has used data from a source that is accessible to replicate his results. That is interesting.
BTW excellent work on that correlation Steven.
This is HUGE!
Arctic melt has been a regional phenomenon. This correlation needs to be trumpeted widely, as it shoots another torpedo into the already sinking warmist ship.
As it is, we -should- have had net sea ice melt, because we -should- be warming, because we are recovering from the Little Ice Age. In reality, there’s not even any net sea ice melt. And also there is no discernible net land ice melt — or we would have noticed that the ocean has risen to some degree. But. going back decades, it is clear that the sea has not risen. I know. I’ve seen the ocean then, and I see it now. It’s just the same.
One man eye-balling the ocean’s level, are you kidding me??! That is the single dumbest observation I have ever heard. I don’t fully expect a person who said something so profoundly ignorant to fully understand this article, but if you want to try and expand yourself beyond the close-minded opinions you currently have, take a look
“Global average sea level rose at an average rate of around 1.7 ± 0.3 mm per year from 1950 to 2009 and at a satellite-measured average rate of about 3.3 ± 0.4 mm per year from 1993 to 2009”
–Nicholls, Robert J.; Cazenave, Anny (18 June 2010). “Sea-Level Sea-Level Rise and Its Impact on Coastal Zones”
What kind of moron would change measurement systems for no reason? Did tide gauges stop working?
Something like this was recognized during the earlier warming period (in papers written in the 30’s and 40’s). The warming was mostly confined to higher latitudes in the northern hemisphere, while, as I recall, the southern hemisphere seemed to be cooling.
All globes are upside down, if they were like this, things would be different:
http://www.cartoonstock.com/lowres/rje0481l.jpg
The Arctic and Antarctic each respond oppositely to the same global forcing mechanism because one is an ocean surrounded by land and the other is land surrounded by ocean.
The key is the degree of jetstream meridionality or zonality.
In theory, more zonal jets whizzing faster round the poles tend to isolate the poles from flows of air in and out so the poles cool.
That works fine for the Antarctic as we have seen during the late 20th century but zonal jets are also associated with warmer ocean surfaces so that warmer water is able to flow into the Arctic Ocean to melt the ice and warm the air.
So Antarctic ice increases as Arctic ice decreases.
In contrast, more meridional jets allow more frequent flows of warm air in and cold air out from the poles which then warm up whilst mid latitudes cool down.
The South Pole gets warmer but meridional jets are associated with cooler ocean surfaces so after a number of years (say 10 to 15) the supply of warm water to the Arctic Ocean is cut off and the North Pole cools whilst the South Pole warms.
In fact the South Pole station has been warming up since the jets began to become more meridional around 2000. For the previous 20 years of more zonal jets the South Pole station actually got colder.
So we are now in a transition period where we just need to await the end of the current positive AMO whereupon the warm water reaching the Arctic will decline and the Arctic sea ice will begin to recover. Meanwhile the Antarctic ice should peak soon and begin to decline.
The Antarctic Peninsula behaves differently but that is off topic for the moment.
“It is good to be learned in the things that are hidden from the wise and the intellectual ones of the world but are revealed, as if by nature, to the poor and simple, to women and little children. ” – Vincent van Gogh (letter to Theo van Gogh, 1878)
Are you sure the R² is not 0.05?
r^2 of 0.05 is not a “very good correlation”! It’s almost Mannian in it’s closeness to 0 (no correlation).
its not it’s o’bviously!
Who needs correlation? All you need to know is that the Russians have a secret powder that can melt the polar ice caps.
http://goo.gl/qlVaA
Interesting to look at the slope like that. Reading by eye: 4.0/0.6 = 6.7
Arctic losing 6 times more than Antarctic gains? It’s not equal but it’s not that bad.
This is a classic example of why you should not use OLS on scatter plots. OLS only works when you have negligible errors in x variable . Here you have roughly equal error in both. The short storey is this will _always_ under-estimate the slope. It’s a mathematical certainly.
Now invert you axes and do the same thing. You’ll probably get a slope of about 2. The truth lies somewhere in between.
You’re in good company though. Most PhD.s don’t seem to know this either. If you want some fun, have a lot at Dessler’s attempts to evaluate climate sensitivity. He does precisely this and comes up with CS=3.
If you plot his data the other way round you will probably “prove” CS=1.0 . May make an interesting post.
May be worth trying something like +/-6m lag , almost certainly get the correlation up a bit.
This may also be of interest:
http://i50.tinypic.com/2mdgitw.png
I would expect the correlation to be four years or more out of phase because it takes at least four years for north atlantic deep water to reach the antarctic
More like 3 😉
http://climategrog.files.wordpress.com/2014/06/ant_arctic_melting_season_lag.png
Derivation here: http://climategrog.wordpress.com/?attachment_id=965