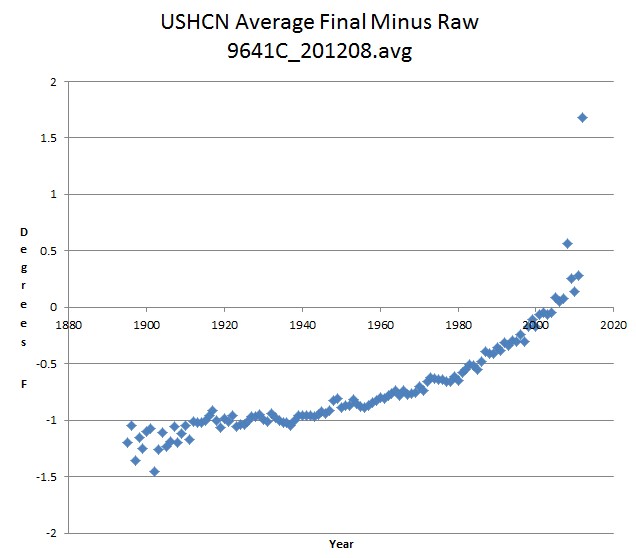
USHCN published only their adjusted data (F52) for August, and did not publish the raw (raw) data.
Index of /pub/data/ushcn/v2/monthly
| Name | Size | Date Modified |
| [parent directory] | ||
| 9641C_201209_F52.avg.gz | 3.6 MB | 9/4/12 11:46:00 PM |
| 9641C_201209_F52.inv.gz | 49.8 kB | 9/4/12 11:46:00 PM |
| 9641C_201209_F52.max.gz | 3.6 MB | 9/4/12 11:46:00 PM |
| 9641C_201209_F52.min.gz | 3.6 MB | 9/4/12 11:46:00 PM |
| 9641C_201209_F52.pcp.gz | 3.9 MB | 9/4/12 11:46:00 PM |
| 9641C_err_F52.max.gz | 520 kB | 11/5/10 12:00:00 AM |
| 9641C_err_F52.min.gz | 523 kB | 11/5/10 12:00:00 AM |
| algorithm-uncertainty/ | 3/1/12 12:00:00 AM | |
| karl-etal1986.pdf | 1.2 MB | 9/27/10 12:00:00 AM |
| karl-etal1988.pdf | 1.6 MB | 9/27/10 12:00:00 AM |
| karl-williams1987.pdf | 1.5 MB | 9/27/10 12:00:00 AM |
| menne-etal2009.pdf | 2.2 MB | 9/27/10 12:00:00 AM |
| menne-etal2010.pdf | 1.2 MB | 9/27/10 12:00:00 AM |
| menne-williams2005.pdf | 441 kB | 9/27/10 12:00:00 AM |
| menne-williams2009.pdf | 2.1 MB | 9/27/10 12:00:00 AM |
| readme.txt | 9.9 kB | 12/15/10 12:00:00 AM |
| software/ | 2/19/10 12:00:00 AM | |
| status.txt | 2.0 kB | 4/11/11 12:00:00 AM |
| ushcn-crs-stations.txt | 13.8 kB | 1/13/10 12:00:00 AM |
| ushcn-mmts-stations.txt | 54.7 kB | 1/13/10 12:00:00 AM |
| ushcn-nws+surfacestations-ratings-1-2.txt | 3.5 kB | 1/13/10 12:00:00 AM |
| ushcn-nws+surfacestations-ratings-3-4-5.txt | 13.8 kB | 1/13/10 12:00:00 AM |
| ushcn-surfacestations-ratings-1-2.txt | 4.6 kB | 1/13/10 12:00:00 AM |
| ushcn-surfacestations-ratings-3-4-5.txt | 28.2 kB | 1/13/10 12:00:00 AM |
| ushcn-v2-stations.txt | 108 kB | 12/15/10 12:00:00 AM |
| vose-etal2003.pdf | 188 kB | 9/27/10 12:00:00 AM |
| williams-menne-thorne-2012.pdf | 1.9 MB | 1/13/12 12:00:00 AM |
Perhaps they don’t want people seeing how they are tampering with the data.


There is no hiding the decline of integrity at USHCN.
I’m sure they’ll publish the raw data after the election if Obama wins. Who knows what they’ll do if Romney wins?
“Who knows what they’ll do if Romney wins?”
Hopefully, they will be part of the budget cuts. I have a thermometer, and it works just fine.
Is that chart showing the adjustments made to the raw data?
Yes, for July
If we had a real media in this country that chart of adjustments would be on the news every night until they stopped the lies.
That, boys and girls, is known as “creating reality”. In other words, you are too stupid to read a thermometer that shows the predetermined warming trend, so Big Brother needs to read it for you.
It’s there now.