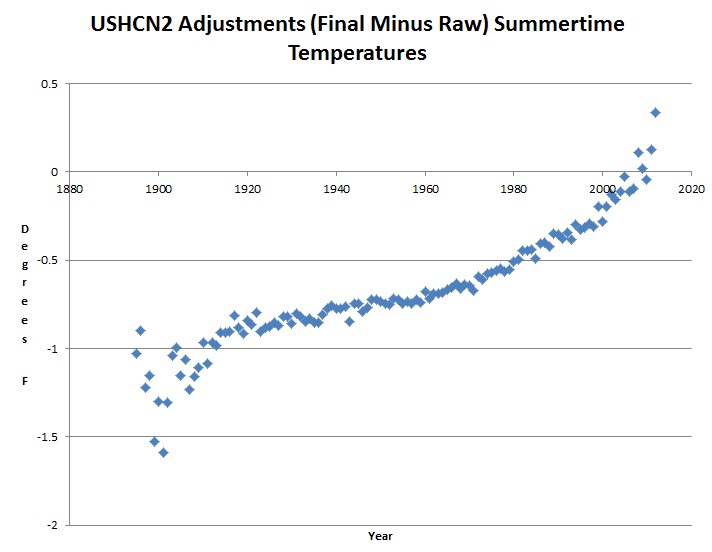
All of these summers were hotter in the US than 2012, according to raw USHCN data.
1936 1934 1901 1988 2006 1900 1933 2011 1931 2010 1952 1937 2002 1943 1921
In order to bring 2012 up near the top, they had to add almost two degrees on to the measured temperatures relative to 1901. The adjustments since the year 2000 have been very impressive, increasing the adjustments by almost a tenth of a degree every year.
ftp://ftp.ncdc.noaa.gov/pub/data/ushcn/v2/monthly/9641C_201209_F52.avg.gz
Gotta keep that panic alive!


There may not be catastrophic warming, but there has been catastrophic cheating.
Steve,
Can anyone explain these adjustments in detail – why and how they were made?
Is it mainly min/max time of day adjustments or is it much more than that? Has the USHCN2 folks explained these adjustments in detail?
Someone needs to dig deep to determine exactly what’s going on and explain in lay terms for folks like me!
The USHCN documentation does not explain any of this.
Global warming truly is man-made, the result of human “adjustments” to raw temperature data. If observational data doesn’t support your cockamamie theory, then just modify the data via homegenization, interpolation and TOB adjustments (while ignoring or downplaying the UHI effect). Isn’t it coincidental that the total adjustments always create a warming signal?
Hansen, Schmidt, Mann, Serreze, Jones and the rest of the “climate change” ringleaders will stoop to any subterfuge to keep the global warming scare alive — and their coffers filled with research dollars. When reality (and a clolder climate) finally sets in, people will realize that the global warming demon was the greatest scientific fraud ever perpetrated against humanity, manufactured by a greedy cabal of pseudo-scientists and carbon traders, with the assistance of their presstitute allies in the corporate-controlled media.
“Homogenization,” not “homegenization.”
As we’ve seen, the True Believers propagating the AGW fraud will do anything to defend their pet theory. Their inflated egos will never allow them to admit they were wrong all along about the trumped up global warming crisis. They will either go down with the AGW ship or abandoned ship when it become impossible to defend their theory without sounding like a delusional crackpot.
OK already. I get it. But does anyone know exactly how they adjust? Has there ever been an explanation by the adjusters in charge?
Seen this graph several times & been meaning to ask (usually don’t have time for more than a quick read): Have all the points below the “0” line been adjusted downward? But that would mean they didn’t start adjusting upaward until about 2009?! I must not be interpreting correctly.
Also, how is the zero line established? Yearly raw avg (looks like about 125 points) over the period shown?
thx,
PJ
I think it works like this …
See,you can do stats on weather data all day long, in dozens of ways, but how do you know if your answer (global temperature) is right?
Why, with Basic Physics(tm), of course! With Basic Physics(tm) you can calculate what temperature the Earth _should_ be, and the difference is your error. So now all you have to do is adjust your stats result to match your Basic Physics(tm) result, and you’ve eliminated the error!
And if your Basic Physics(tm) model is CO2 dependant, then your temperature curve will perfectly match your CO2 curve, proving that CO2 caused the temperature change and that your Basic Physics(tm)is correct.
It’s like magic! (Well, it certainly isn’t science.)
Basic Physics(tm) is a trademark of the UN.
“In order to bring 2012 up near the top, they had to add almost two degrees on to the measured temperatures relative to 1901. The adjustments since the year 2000 have been very impressive, increasing the adjustments by almost a tenth of a degree every year.”
Let me put it this way… if we were talking, instead, about financial figures of a corporation, we would be talking about the fraudulent manipulation of accounts… criminal activity.