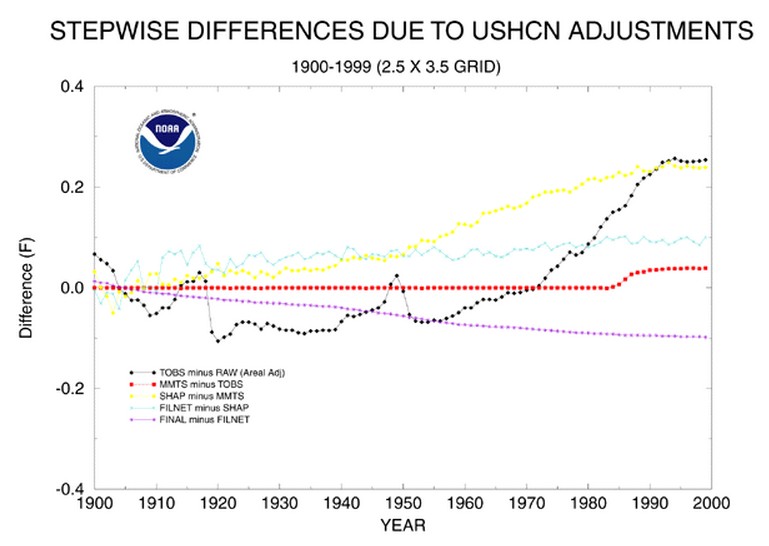
According to USHCN2 documentation, the TOBS adjustment hasn’t changed from USHCN1. The graph below shows that the TOBS adjustment in USHCN1 varied from -0.1 to 0.3, and was flat after 1990.
ts.ushcn_anom25_diffs_pg.gif (650×502)
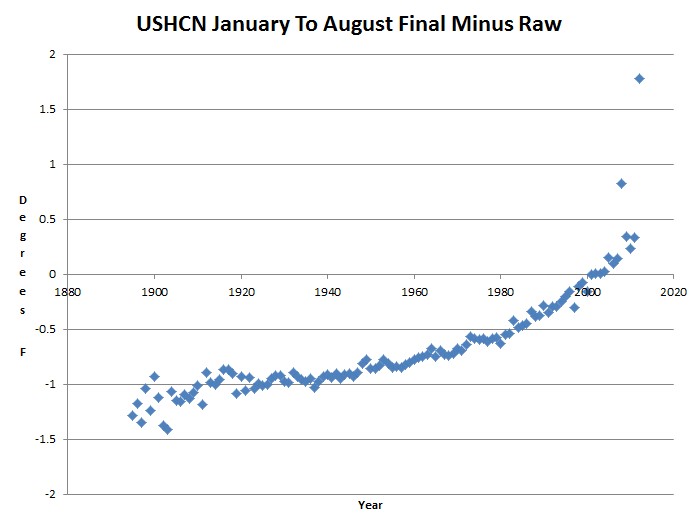
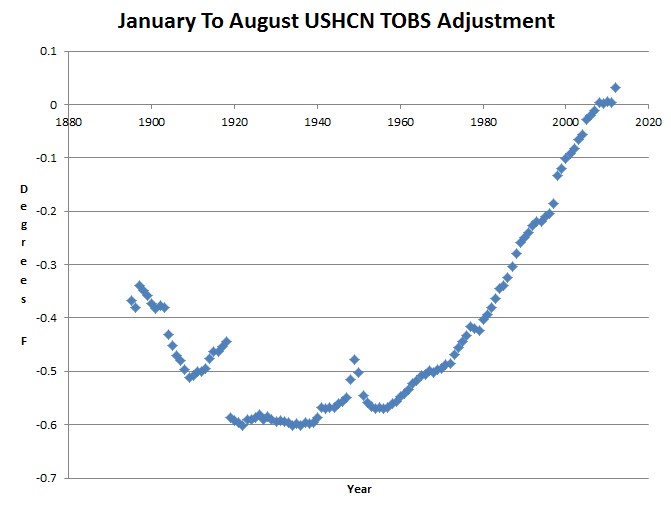
The USHCN2 TOBS adjustment is nearly twice as large, ranges from -0.6 to 0, and continues to increase after 1990.
Index of /pub/data/ushcn/v2/monthly
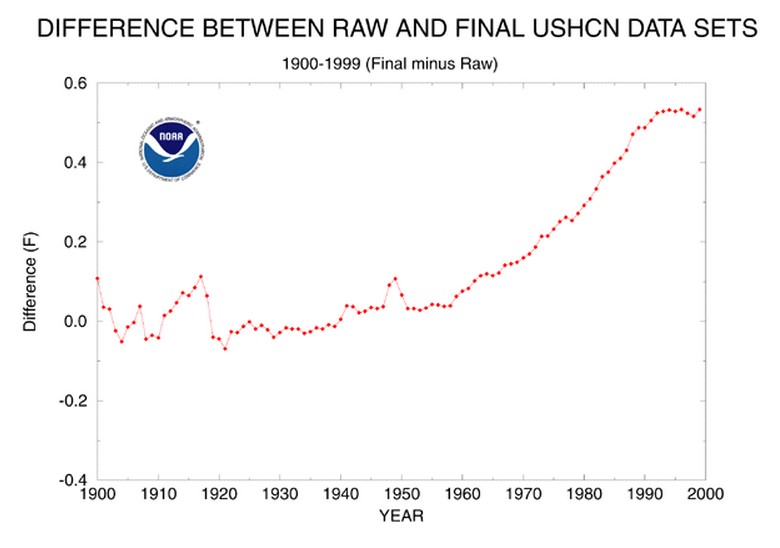
If it was the same algorithm as they claim – the graphs would be identical through the year 2000. Obviously it isn’t.
The final minus raw for USHCN1 ranged from 0 to 0.5, and was flat after 1990
ts.ushcn_anom25_diffs_urb-raw_pg.gif (650×502)
The USHCN2 final minus raw is 600% larger, and goes up exponentially after 1990. Just in the last year, the adjustment has increased by more than a degree.
Index of /pub/data/ushcn/v2/monthly
The US government is cheating and robbing us blind.


Reblogged this on Climate Ponderings.
Well,, after watching your Howard Stern video, is it any wonder how they can do it? Like anyone even knows. Nobody pays attention to anything, even those things squarely in their faces.
We need to get the word out!!
Where is Mosher to explain what is going on here to us when we need him?
As usual he is lost in progress.
OT, but a must read: http://johnosullivan.wordpress.com/2012/09/23/courts-not-scientists-thrust-greenhouse-gas-science-into-law/
Only the truly faithful can see these charts as anything other than fraud.
The planet isn’t warming, so the climate change scammers have to manufacture it. Anything to keep the scare story alive and grant money flowing. I looking forward to the day the fright-mongering charlatans are prosecuted for fraud.