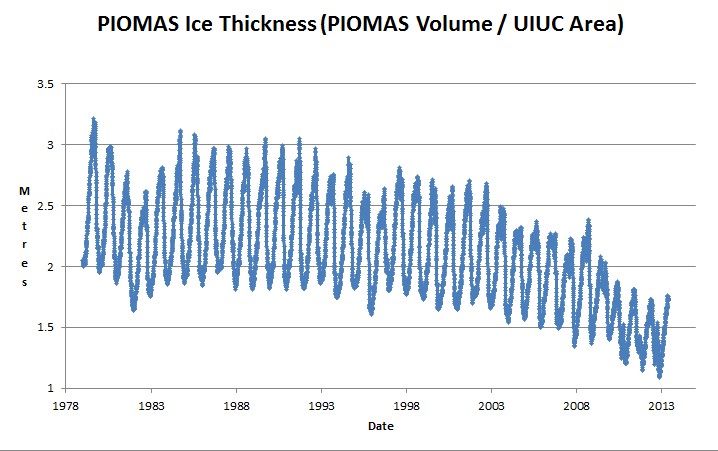
PIOMAS shows that Arctic ice used to gain about one metre thickness per winter, and now it gains half that much.
That makes no sense, because thicker ice insulates the water surface better and inhibits ice formation. We should see more ice formation now because the ice starts the winter thinner, insulates the water less, and thus more heat transfers from the water to the air. More heat loss from the water means more ice formation.


great observation!
Except the observation is crap and shows a woeful – and perhaps wilful – disregard for the science. Anyone who thinks this makes any sense needs to be back at school.
I will wait for T.O.O to explain why this makes perfect logical sense.
That might be true if all other things were held constant, but of course they aren’t constant. Ice forming from open water has to wait for a lot of energy to go into the phase transition. If the water temperature increased, then there is more heat to dispose of before refreezing begins, and less time throughout the winter for ice to thicken. Also issues with salinity.
PIOMAS does have its own ice thickness chart:
http://psc.apl.washington.edu/wordpress/wp-content/uploads/schweiger/ice_volume/Bpiomas_plot_daily_heff.2sst.png
though Steve’s graph does effectively show the a long term, accelerating decline. Now why would that be? Is it natural, cyclical variation, or is it…
Are the following connected?
Arctic Temperatures – Daily Mean Temperatures North of 80 degree North.
http://ocean.dmi.dk/arctic/meant80n.uk.php
and
Masie Region 11 – Central Arctic Ice Extent, which still appears to be increasing?
ftp://sidads.colorado.edu/DATASETS/NOAA/G02186/plots/r11_Central_Arctic_ts.png
Makes sense, due to the record relative cold this year. Would be nice to compare with 2004, when the start of summer had similar temperatures.
Thanks for the links.
I see NSIDC will be replacing their baseline years next month…
http://nsidc.org/noaa/news.html#first-note-change-to-30yr
These maxims about climate normals come from the world of weather and climate. Sea ice responds to climate forcing differently, and the assumptions behind the use of 30-year normals for meteorology may not hold true for sea ice, particularly in light of the rapid decrease and repeated record low minimum extents in the Arctic during the past decade.
Some weasel-worded resentment from NSIDC because things are not going to look so bad in the future.
Makes sense … how does it compare with Cryosat II data?
Perhaps you don’t understand how thick ice actually forms in the Arctic. For instance, if it formed more by ridging and slabbing, in addition to simple freezing, then perhaps the thinness overall could have a significant impact on that mechanism through the loss of rigidity…
Or maybe the thickness just reflects the fact that there is a whole lot of first year ice, and precious little of the multiyear variety–the resulting mean thickness would be lower, wouldn’t it?
Just a couple of random thoughts.
After all, it made lots of sense to some last year when this blog proposed that the August cyclone would bring an end to the seasonal melt.
Steve,
You have asked me to comment on this which I suppose is your “proof” that PIOMAS is “complete crap”.
Your contention is that thicker ice insulates better than thinner ice, which I suppose is true, but what I don’t know is when that insulation has reached its maximum. Does a 10 foot thick piece of ice insulate better than a 6 inch piece? Do you know? At what thickness does this become irrelevant — does a 6 inch slab insulate only 0.0000001% better than a 3 inch slab? And what of the temperature differential between the sea water and the air temp above? What about warm currents or currents with higher salinity? Do you know how to answer these questions and shouldn’t you know if this is what you are hanging your reputation on?
And is your question even relevant? Doesn’t ice grow downward? And what of falling snow that compacts into ice? And what about drift that causes build up of ice? And circulation patterns will cause ice to either compact or disperse.
Your “it doesn’t make sense” statement as proof of PIOMAS being crap looks to be grade school reasoning and you still have not provided anything I would call evidence.
Yes, all that record thin ice is melting super fast this summer.
Steve,
That is your rejoinder? You didn’t really clear anything up.
The summer is just getting started and, yes, the low ice volume PIOMAS has told about will soon manifest itself in a dramatic fashion particularly because the extent is so spread out.
Just click your ruby slippers together three times and the ice will melt.
I will freely admint that I am not an expert but there may some room for more science in this discussion. As far as I know heat moves in one of three ways: conduction, convection and radiation. Ice free surfaces would have heat losses associated with all three modes while an ice covered surface would be dominated by radiation and conduction. A snow covered surface would be more dominated by conduction since I would expect the snow would effectively reflect radiant heat. As the ice (or snow) thickens the insulation value increases (proportional to the thickness) and the rate of grow will slow.
Wouldn’t the the thickness of ice formed be a function of the the “heat sink” (air) temperature and the duration? Like observing that when it is colder it costs more to heat your house.
Is there a correlation between ice volume and the average below zero (C) degree days (factoring in surface area where temperature was below zero as well)? This could be done for the entire basin volume or for the thickness at a specific point.