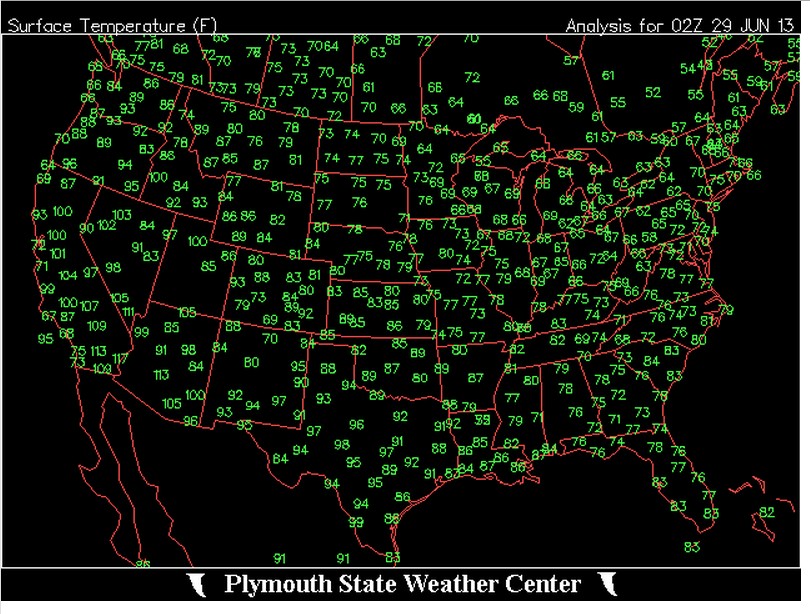
“Freak heat means a typical end of June day in the southwest”
Concur. I can’t say how many times I’ve been in the Southwest this time of year and experienced these temps as a matter of course. It’s the desert. In summer. It’s supposed to be hot. I haven’t seen any of the AGW zealots explain what ‘normal’ temperatures are supposed to be.
Me neither, but I reckon they expect to wake up to glorious sunshine, 25C every day.
I read somewhere that there should be a chart depicting at what weather/climate events the alarmists come out of the woodwork. That’s easy – any temp chart. It goes up 0.1C, they become more shrill. Pretty simple and until they conceded the “pause” and started to make excuses such as “warming = cooling”, about 97% accurate.


do you have the anomaly data?
No but I have lived most of my life in NM, CO, AZ, TX and CA and these are typical temperatures for this time of year.
Woah.. look at all those numbers.. I’m freaked out!
“Freak heat means a typical end of June day in the southwest”
Concur. I can’t say how many times I’ve been in the Southwest this time of year and experienced these temps as a matter of course. It’s the desert. In summer. It’s supposed to be hot. I haven’t seen any of the AGW zealots explain what ‘normal’ temperatures are supposed to be.
Me neither, but I reckon they expect to wake up to glorious sunshine, 25C every day.
I read somewhere that there should be a chart depicting at what weather/climate events the alarmists come out of the woodwork. That’s easy – any temp chart. It goes up 0.1C, they become more shrill. Pretty simple and until they conceded the “pause” and started to make excuses such as “warming = cooling”, about 97% accurate.
It’s fun watching them flail.
Ketlle Falls WA seems to be pretty hot. Or could by any chance 129 degrees be a mistake?
http://www.wrh.noaa.gov/mesowest/getobext.php?wfo=otx&sid=KTLW1&num=72&raw=0