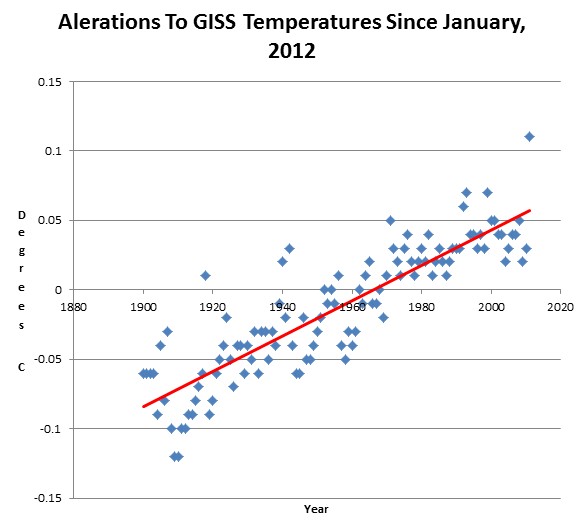
Joe D’Aleo sent an E-mail this morning mentioning that GHCN has cooled the past again.
Below is a plot of alterations to GISS temperatures since January, 2012. They are constantly rewriting history by warming the present and cooling the past.
Someone made this comment at Climate Audit a few years ago :
If the present refuses to get warmer, then the past must become cooler.


That is a optional feature they built into their models. It is one of the Tweaking Parameters that make the temperature records fit the model output! Absolutely a necessary feature to maintain the funding.
I’d love to see how much they “adjusted” the Nebraska 1936 data in the current GISS “data set”. (data set in quotes since GISS is such a fabrication with all the alterations)
As Steve has so wonderfully pointed-out with all those historical news clippings, you cannot alter history, 1984 style, as completely as the alarmista could wish. The inconvenient historical records will continue to bite GISS “truthiness” in the backside.
The weather forecasters we mocked so much in the past were never so duplicitous as to attempt to alter the past to make their failed forecasts look better. The current crop of “climate scientists” must have come from a long line of con men and shysters.
Reblogged this on The Firewall.
It’s an algorithm.
Every month when they add in the new numbers, the algorithm runs through the whole data set, rewriting it around the pivot point.
They just keep getting smarter. Maybe someday we will discover that a LIA caused the Great Depression.
GISS are only trying to deliver on their promises. 🙂
And here I was thinking that the sun went quiet.
God, what they have done, and continue carelessly to do, to Robert Goddard’s name and legacy. I remember when “Goddard Institute for Space Studies” was the ne plus ultra of scientific institutions (perhaps it was only in my mind).
I have seen such graphs so may times on your site, and every time I wondered what the effect is on the reported temps. It looks like much of the warming is due to those adjustements. But how much exactly? All of it?
Could you create graphs showing the official temps, and oppose to graphs showing the uncorrected temps, and show the warming in deg/decade for both?