
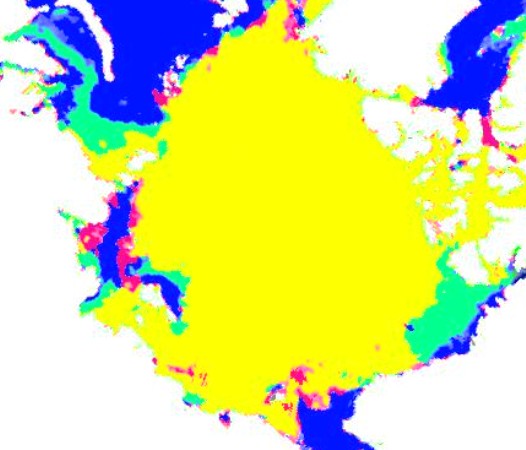
Green shows areas of ice present in 2013, but not present in 2012. Red shows the opposite.
The Beaufort Sea is the big problem for alarmists. In June 2012, wind opened it up early causing lots of solar energy to be absorbed and warming of the water. That didn’t happen this year, and with the sun starting its decline the opportunities for a big melt are getting slim.

The assertion that a big melt is unlikely seems to contradict the information on the Watts up with That Sea Ice reference page which shows, in graph after graph, that the amount of ice is lower than average and nosediving at a rapid rate.
http://wattsupwiththat.com/reference-pages/sea-ice-page/
I see. So the ice melting out in Hudson and Baffin Bays affects this discussion how?
ROFLMAO
Richard, the long term trend has been for sea ice to decrease in the arctic and increase in the antarctic. The composite being that global sea ice has remained close to the same. Year by year changes, I am sure you would agree are meaningless.
These observations should be leading to studies of various decadal changes that may be happening such as vertical and horizontal ocean currents moving more saline water to the north pole area and away from the sourth, as well as atmospheric changes.
Since the discussion has been almost all about the arctic only except for one part of the antarctic, I believe that Steve is simply reacting to all the discussion about the arctic, categorically refuting each and every aspect of the continual AGW blitz as applied to the arctic.
So the point I missed is that you are only referring to ice above the arctic circle.
I think another point I missed is that you are only comparing this year to last year.
Right now the Arctic ice is comparing well with the trends in 2008 and 2009,
http://ocean.dmi.dk/arctic/plots/icecover/icecover_current.png
This is very important because 2009 is the third best level (3rd largest ice extent at the peak of the summer) since 2005. It would mean an important recovery if 2013 ends up matching the 2009 levels.
Reblogged this on Gds44's Blog.
Steve.—- Did you mean June 2012, wind opened it up earlyl??
There were strong storms in the NP last year that, unfortunately for the GW alarmists, are not repeating this year. Probable cause: lower solar radiations.
I booked my ice free arctic cruise and now its not going can I sue NASA? http://www.youtube.com/watch?v=ztz3ZdPbdKo
LMAO at the little tipping point demo. That seals it, we’re doomed! HAR HAR
“That didn’t happen this year, and with the sun starting its decline the opportunities for a big melt are getting slim.”
Two problems. The first is illustrated by one of my favorite images.
http://imb.crrel.usace.army.mil/2006Csum.htm
I’ll draw your attention to the brilliantly colored thickness/temperature graphic.
2006C spent a significant portion of its life in the Beaufort. In 2007, from July 1, to the 1st week of September, it showed a drop in thickness from about 300CM, down to about 120 or so. The bottom melt really did not start in earnest until well after the May/June melt. During that same period, it went through almost 75CM of top melt. 255CM of melt, all told. The upshot is, that bottom melt doesn’t really start until the ice temperature has equalized approximately with the sea water temperatures, and that typically doesn’t happen until after the solstice. We are just entering the period during which melt will start in earnest.
Problem the second is, not all extents are equal. The graphic you present of the Central Arctic Basin and adjacent seas implies a vast, unbroken expanse of ice. It is anything but. I’ll draw your attention to some lance-modis images:
http://lance-modis.eosdis.nasa.gov/imagery/subsets/?mosaic=Arctic.2013185.terra.4km
… and a specific sub-image:
http://lance-modis.eosdis.nasa.gov/imagery/subsets/?subset=Arctic_r04c04.2013185.terra
This last shows an image approximately 300KM from the pole. The ice concentration here is comfortably under 70%.
Here’s an image of the same area ten days later in 2012:
http://lance-modis.eosdis.nasa.gov/imagery/subsets/?subset=Arctic_r04c04.2012195.terra
The margin of the 2012 melt is visible under the clouds in the upper right hand corner. That said, examination of the rest of the pack indicates a concentration in excess of 90%, and for the most part, in excess of 95%.
My assertion then is, that claiming that increased 2013 extent shows a recovery, is as yet, standing on rather thin ice. 😉