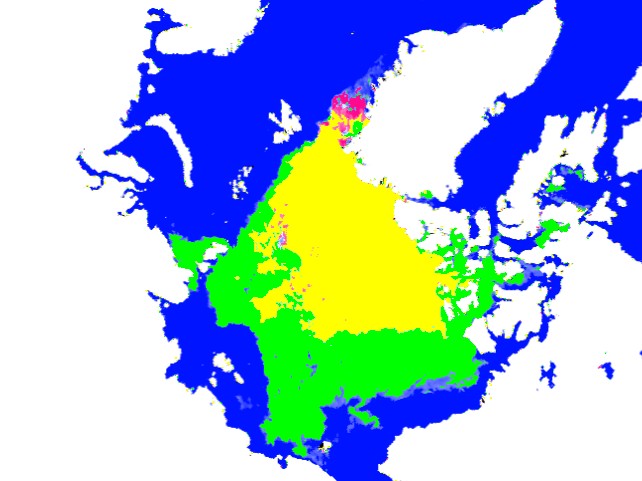
The image below compares current Arctic sea ice extent vs. YouTube spontaneous protest day – September 11, 2012. Green shows ice present now which wasn’t present on that date. Red shows the opposite.
Disrupting the Borg is expensive and time consuming!
Google Search
-
Recent Posts
- Analyzing The Western Water Crisis
- Gaslighting 1924
- “Why Do You Resist?”
- Climate Attribution Model
- Fact Checking NASA
- Fact Checking Grok
- Fact Checking The New York Times
- New Visitech Features
- Ice-Free Arctic By 2014
- Debt-Free US Treasury Forecast
- Analyzing Big City Crime (Part 2)
- Analyzing Big City Crime
- UK Migration Caused By Global Warming
- Climate Attribution In Greece
- “Brown: ’50 days to save world'”
- The Catastrophic Influence of Bovine Methane Emissions on Extraterrestrial Climate Patterns
- Posting On X
- Seventeen Years Of Fun
- The Importance Of Good Tools
- Temperature Shifts At Blue Hill, MA
- CO2²
- Time Of Observation Bias
- Climate Scamming For Profit
- Back To The Future
Recent Comments
- Bob G on Analyzing The Western Water Crisis
- Robertvd on Analyzing The Western Water Crisis
- Bob G on Analyzing The Western Water Crisis
- conrad ziefle on Analyzing The Western Water Crisis
- Bob G on Analyzing The Western Water Crisis
- arn on Analyzing The Western Water Crisis
- conrad ziefle on Analyzing The Western Water Crisis
- Bob G on Analyzing The Western Water Crisis
- conrad ziefle on Analyzing The Western Water Crisis


Is it green because it’s rotten?
No, it is green because it is thin slushy first year ice that has not yet ripened.
What will be the excuse for this years record cold? To much Arctic sea ice?
Zactly. As if there is an amount that is “just right.”
It’s always wrong, and it’s always Man’s fault.
The Arctic ice was hiding at the bottom of the ocean in 2012. It has been kicked upstairs by all that heat hiding down there. Elvis is down there as well.