Disrupting the Borg is expensive and time consuming!
Google Search
-
Recent Posts
- Gaslighting 1924
- “Why Do You Resist?”
- Climate Attribution Model
- Fact Checking NASA
- Fact Checking Grok
- Fact Checking The New York Times
- New Visitech Features
- Ice-Free Arctic By 2014
- Debt-Free US Treasury Forecast
- Analyzing Big City Crime (Part 2)
- Analyzing Big City Crime
- UK Migration Caused By Global Warming
- Climate Attribution In Greece
- “Brown: ’50 days to save world'”
- The Catastrophic Influence of Bovine Methane Emissions on Extraterrestrial Climate Patterns
- Posting On X
- Seventeen Years Of Fun
- The Importance Of Good Tools
- Temperature Shifts At Blue Hill, MA
- CO2²
- Time Of Observation Bias
- Climate Scamming For Profit
- Climate Scamming For Profit
- Back To The Future
- “records going back to 1961”
Recent Comments
- conrad ziefle on Gaslighting 1924
- arn on Gaslighting 1924
- Gordon Vigurs on Gaslighting 1924
- Bob G on Climate Attribution Model
- conrad ziefle on Climate Attribution Model
- Ohio Cyclist on Climate Attribution Model
- Bob G on Climate Attribution Model
- Bob G on Climate Attribution Model
- Bob G on Fact Checking NASA
- arn on Climate Attribution Model
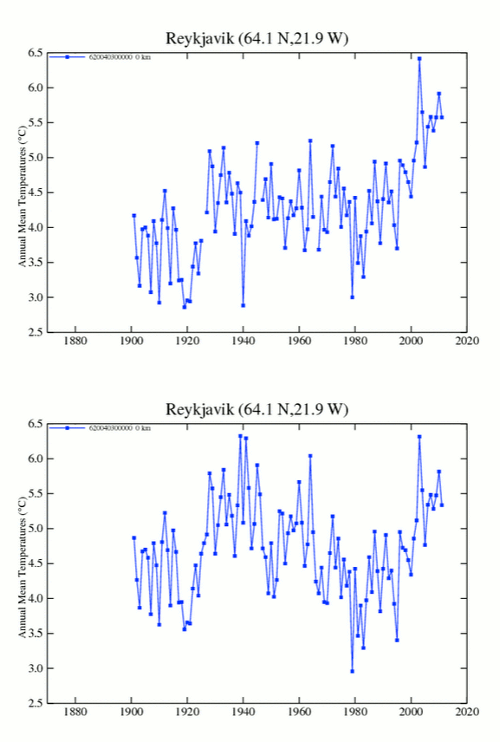
NASA : That Warm Period In 1940 Wrecks Our Story – Let’s Get Rid Of It
This entry was posted in Uncategorized. Bookmark the permalink.


Steve, do you know this link?
http://www.climate4you.com/ClimateAndHistory%201900-1949.htm
It has many documented stories about hot periods in the first half of the XX century, in particular the “warm years” in the Arctic during the WWII.
The following chart
http://www.climate4you.com/images/MAAT%2070-90N%20HadCRUT3%20Since1900.gif
is an important guide for the whole analysis, showing the Arctic region nearly as hot as today in the late 1930’s and early 1940’s.
Now, if the LIA ended on ~ 1850 and solar radiations were not so strong up to the second half of the XX century, then were did all this heat (especially in the 30’s and WWII years) come from?
On the other hand, if the solar radiation is to be blamed for the “previous global warming” the climate is strongly sensible it then how could it get so cold during the LIA? There are many “dots” in this story that are not connecting.
err… and the climate is strongly sensible to it then …
Reblogged this on Climate Ponderings.
Similar?:
http://i46.tinypic.com/t63qxe.jpg
I didn’t use that Grand Canyon infographic much in the past after making it since there was so much churning controversy on blogs about whether adjustments really mattered to the resulting global averages.
I cannot ever imagine any of my teachers or professors allowing me to get away with this kind of nonsense. Only the government can adjust historical data, and print money to fund it.
More Orwellian than anything Orwell could imagine!
( Pardon the cross post )
This “Let’s Get Rid Of It” is a good idea for a series, Steve. They make for nice links to throw at climate kooks and crooks.
I count three so far, did I miss any? You’ll need one for the 1930’s also.
NASA : That 90 Year Long US Cooling Trend Wrecks Our Story : Let’s Get Rid Of It
IPCC : That Medieval Warm Period We Used To Believe In Wrecks Our Story, Lets Get Rid Of It
NASA : That Warm Period In 1940 Wrecks Our Story – Let’s Get Rid Of It
Yea I like that. There are thousands upon thousands of examples