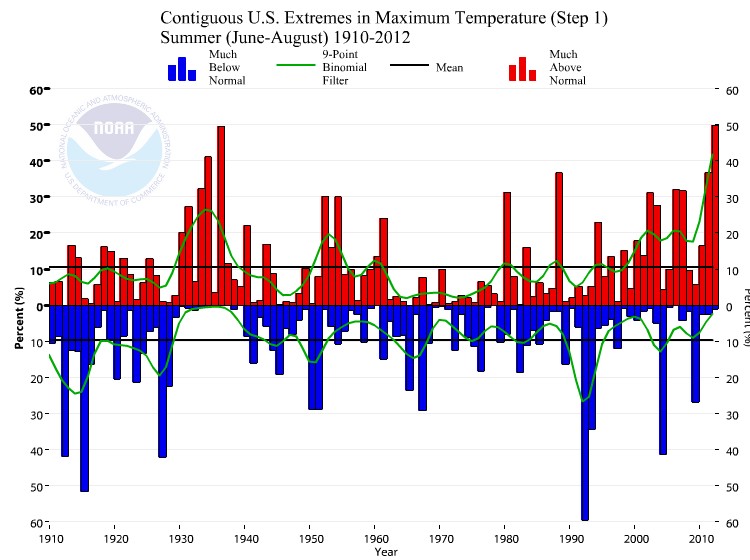
The NOAA US Climate Extremes Index shows that 2012 maximum summer temperatures were tied for the highest on record.
Extremes | U.S. Climate Extremes Index (CEI)
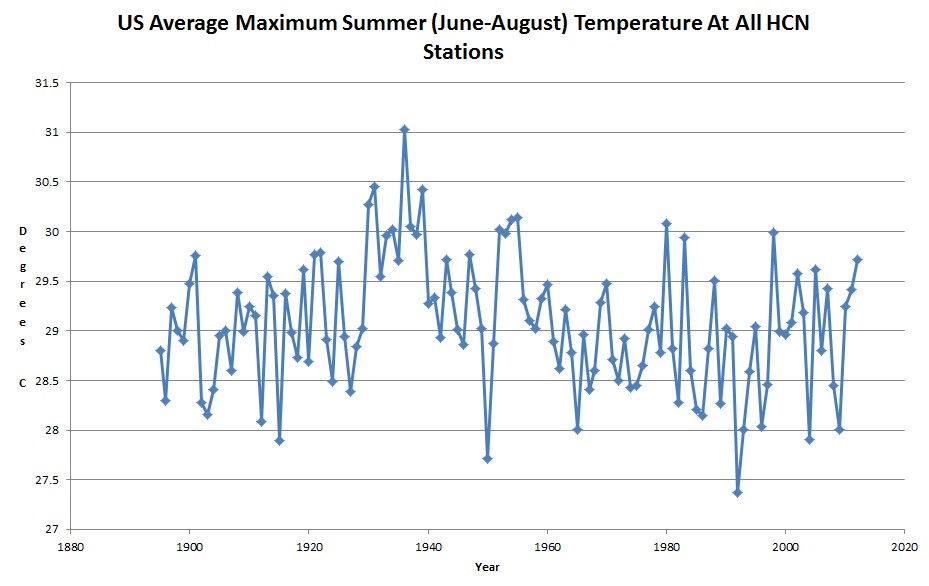
This is utter nonsense. According to GHCN US data, the summer of 2012 had the 21st hottest maximum temperatures, was more than 1C cooler than 1936, and was cooler than most of the years in the 1930s.
Index of /pub/data/ghcn/daily/hcn/
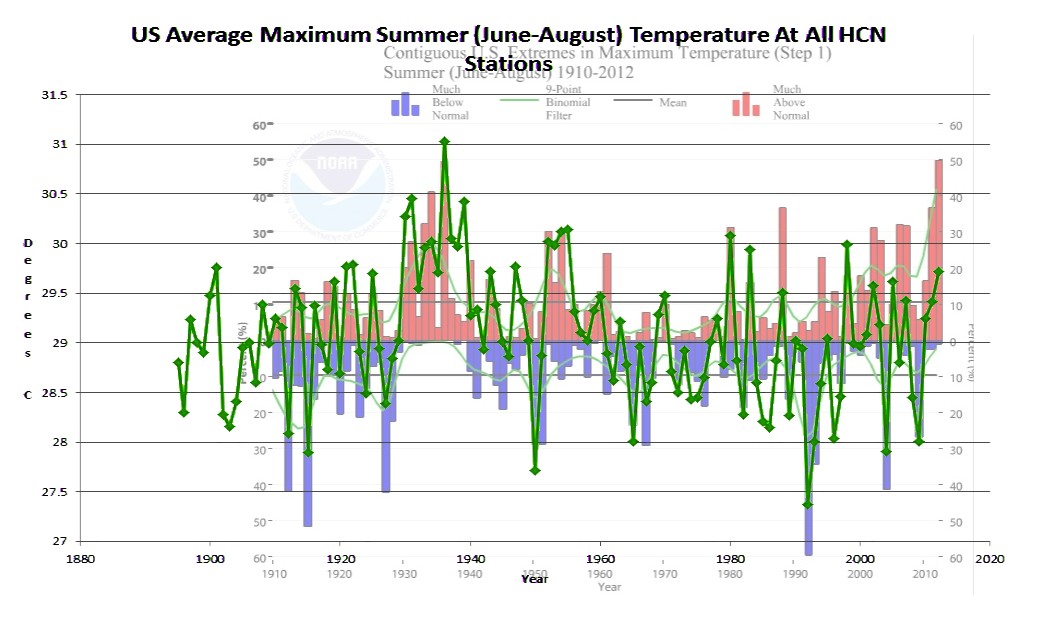
The next graph overlays the HCN data on the CEI data. The match isn’t too bad until about the year 2000, when NOAA started fabricating data to pump the numbers up.
NOAA shows the summer of 2006 as being 7th hottest on record, when in fact it was the 82nd hottest.
The EPA says that summers in the 1930s were much hotter than any summers prior to 2009. Why does NOAA think they can get away with lying about this?
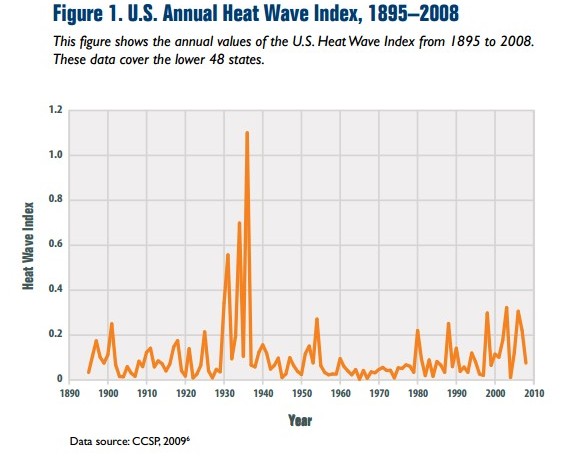
Heat waves occurred with high frequency in the 1930s, and these remain the most severe heat waves in the U.S. historical record (see Figure 1)


Reblogged this on CACA and commented:
Data Tampering. What a disgrace.
Millions of working families suffering to pay electricity bills and find jobs. All because Climate Change alarmists with their snouts in the climate gravy-train trough promulgate the global warming scare with fraudulent data to keep the grant money flowing and their precious, elite reputations in tact.
The mainstream media no better. Keeping NOAA, NASA, GISS, USHCN blatant data tampering under wraps ~ Exposing a government data tampering scandal clearly would’t be in the best interests of Gaia.
Meanwhile the punters keep paying climate guilt money to Obama, Australia’s Labor/Green alliance and all the other western Governments heavily invested in the biggest scientific hoax and fraud ever perpetrated on humanity.
So Wrong.
Like the heat wave index, the percentage of the United States
affected by heat waves has also risen steadily since the 1970s (see
Figures 2 and 3). The recent period of increasing heat is distinguished by a rise in extremely high nighttime temperatures
HMMMM no heat islands
This is a discussion of daytime temperatures.
I am aware of this. That comes from the key points of your EPA link
I’m trying to keep it clear that this not a UHI issue. It is a fraud issue.
Like the heat wave index, the percentage of the United States
affected by heat waves has also risen steadily since the 1970s (see
Figures 2 and 3). The recent period of increasing heat is distinguished by a rise in extremely high nighttime temperatures.
Again, this is a discussion of fraudulent daytime temperatures. It has nothing to do with UHI or nighttime temperatures..
I’m with you but that caught my eye. I’ll try and stay on topic next time. Please excuse
Sorry for duplicate delete please
The very concept of objective truth is fading out of the world.
Lies will pass into history.
– George Orwell
Steven,
The EPA now has a more up to date heatwave graphic on their website. Needless to say, it appears some fiddling has been done. I noticed they did lower some peaks post 1988 also around 1930s. I didn’t do a full examination tho’.
http://www.epa.gov/climatechange/science/indicators/weather-climate/high-low-temps.html
The Kunkel 2013 data source is purportedly built on the CCSP 2009 your graphic uses.
Thanks for that!
What is your data source cited as either “GHCN US data” and “HCN” ? Most credible sources spell out acronyms the first time they are used and also include links to the source data. Why should anyone accept your word with no verifiable data source citations unless your words support what they already believe?
ZZZZzzzz
Just because it is titled “Real Science” does not make it so. http://www.desmogblog.com/steven-goddard
Moron alert
Wait, Desmog, would that be the blog funded by a criminal? Well, yes. They must be entirely believable, then.
Care to refute the info in the graphs?