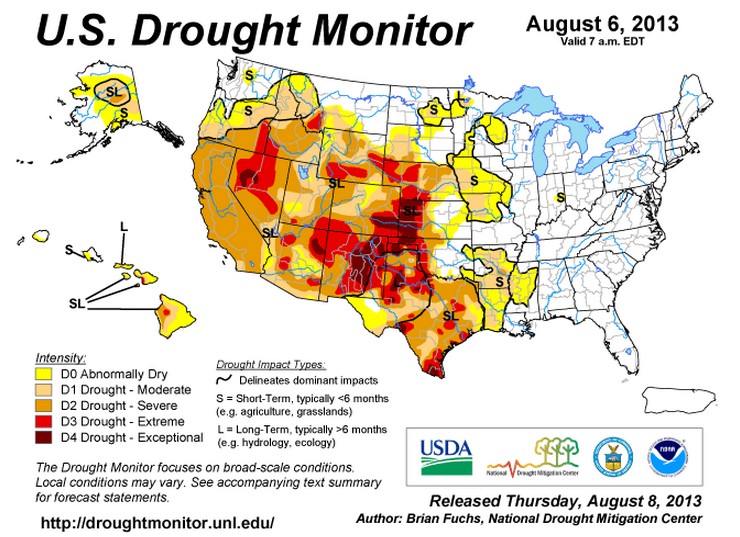
The Washington DC based US Drought Monitor says that the southwest is having an exceptional drought.
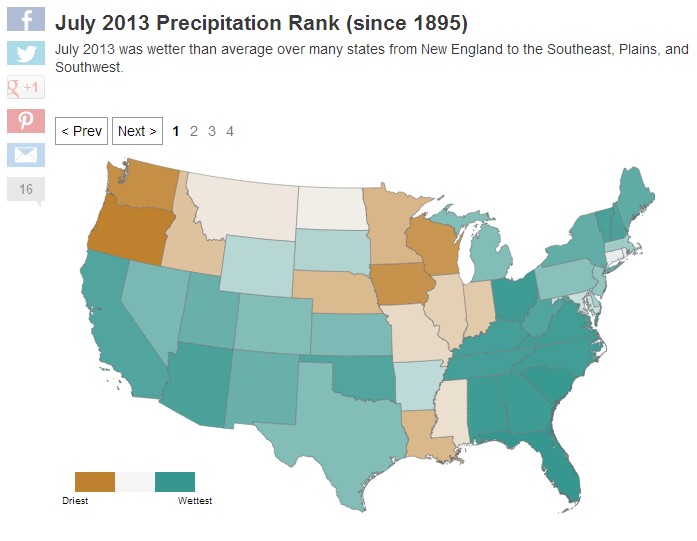
The Weather Channel says that this summer has been one of the wettest on record in the southwest.
July One of Wettest on Record in U.S., NOAA Says – weather.com
Joe Romm says that the southwest is having a permanent drought.


no, it isn’t permanent (unless the climate change people are deliberately towing rainclouds away from us LOL), and it is no longer as desperate as it was in 2011, but Texas is still in a drought. What we have been blessed with are sporatic high-volume rains, which help tanks and lakes and trees hang on until the regular rain starts up again; but we still are not getting regular rains, the kind that keep the ground moisturized and the air humid. For instance, in 2 days rain a couple weeks ago, my town’s lake recovered 6 feet of water! God has been very good to answer the prayers Governor Perry led us in in 2011, and we have had sufficient rain since then to tide us over and keep wildlife alive. The drought will end when the next el nino cycle kicks in, I think. In the meantime, we’d love a couple of good hurricanes barrelling inland. 🙂
Even if they had one wet month, New Mexico has been exceptionally dry for the past 1,000 years. That is why it is called a desert!
So far, it has been one mild, temperate summer here in Southern Arizona. What happened to Man-Made Global Warming? Isn’t it supposed to be getting hotter in the summer “all things being equal” and all that? What’s not equal right now? Anybody know?
Keep in mind, the July dust storms Romm refers to result from massive downdrafts of cold air out of summer thunderstorms. More dust storms like those = greater possibilities for heavy rain.
Is this week’s “US Drought Monitor Map” any different than the map that preceded it? Or did the date at the corner automatically change, while everyone was off on vacation?
The lower right hand corner of the map states the author of the map is “Brian Fuchs.” Someone should contact him, and ask him if he knows his map shows drought in places they’ve had floods.
Ten-to-one he’s on vacation, and delegated the job of updating the map to someone who also is on vacation, and who delegated the job to a third person who can’t figure out how to run the computer.
In any case, I wouldn’t like to have my name attached to a map that shows drought where they are having floods.
The only explanation I can think of is they weigh the average precipitation over a long period of time, e.g. 2 years like they do for golf rankings.
Anyone know how the algorithm works?
John:
Spelling Correction! When referring to the Drought monitor it is Al-Gore-Rhythm! 😉 We must give credit where credit is due! That is the proper spelling for any thing related to Climatology It is either that or Hansen’s Wet Dream’s Prodigy.