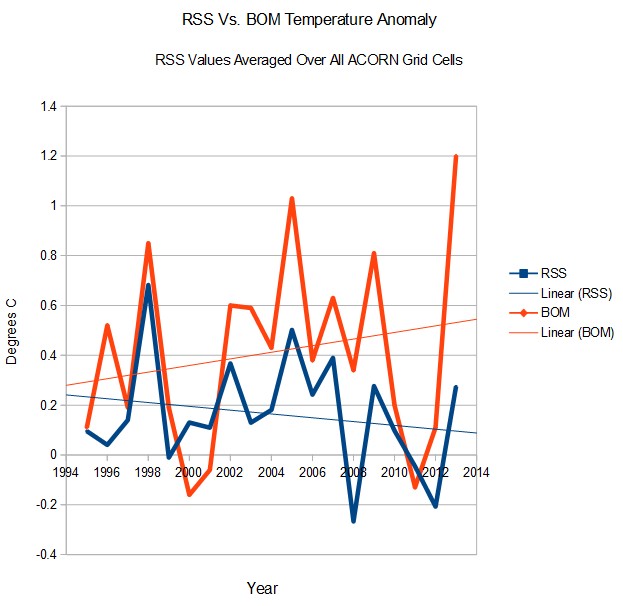
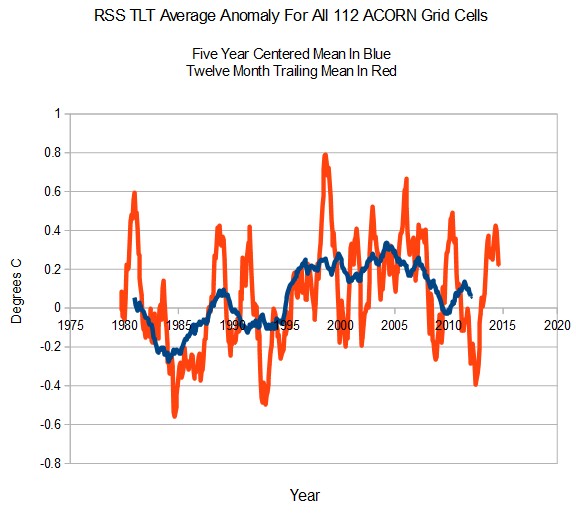
I tried an experiment today, and calculated the average RSS TLT anomaly for all 112 ACORN grid cells.
Last year was not even close to being the hottest year, and is diverging from BOM surface temperatures at a rate of 2.2°C per century over the last two decades.
Temperatures in Australia are about the same as they were at the start of the satellite record. Many years were warmer than 2013.


Nice one Tony.
Shows up the fraud.
Snow in October shows how silly the whole CAGW scare from the BOM is. Katoomba near Sydney got 6 inches overnight, due to a Low pressure weather pattern. Australian Greens are “losing their minds” right now as if they had any to begin with.
Heh.. Don’t worry, BOM will keep faking and adjusting until they have a vertical line. When finally everyone realises that it’s NOT 100c outside, they’ll be asking questions (with any luck from our apathetic population).
I don’t think the population is apathetic, as such: they are exhausted, malnourished (especially the obese ones), and just want to relax and hear what Jennifer Keyte or Mal Walden tell them is the truth (and that’s their only source of information… although folks who consider themselves sophisticated might watch ABC/SBS news thinking it’s not just propaganda).
Also, the vast majority of the population are simply not capable of the levels of cognition required to process information of any significant level of complexity (thanks, government schools!).
That might sound a tad ‘elitist’, but there’s a series of massive OECD-wide studies into adult literacy, numeracy, and problem-solving that really do show – definitively – that the median adult in the OECD has the literacy and numeracy of about a 9th-grader (at best). The OECD median score in the test (which is out of 500) is 273([1],[3]) – i.e., 55.2% – which really is abysmally bad, if you look at the test content.
What can be inferred from these studies is that an IQ of 100 (the median) does not equip an individual with the “minimum level of competence needed to cope adequately with the complex demands of everyday life and work” in an OECD-style economy [2].
The emphasised quote about ‘minimum level of competence etc’ is the definition of “Level III” from the results papers from previous surveys (ALSS/IALS – the forerunner of PIAAC): it appears that the definitions page was dropped for the PIAAC under pressure from America, whose performance was bottom-quartile in all aspects (“bloviating about freedom and democracy while slaughtering brown children from the air” was not an assessment task).
More alarming: only 1% (in fact less: 0.7%) of adults achieve “Level V” (the highest score – equal to scoring about 75% on the various assessment tasks).
In fact “Level V” folks are so demographically rare – roughly as rare as a person with an IQ of 136 – that V’s are statistically insignificant for cross-country comparisons, so they are reported lumped in with the IV’s.
And yet Level 5 is the only level where individuals are able to “search for and integrate information across multiple, dense texts; construct syntheses of similar and contrasting ideas or points of view; or evaluate evidence based arguments. [The questions] often require respondents to be aware of subtle, rhetorical cues and to make high-level inferences or use specialised background knowledge.” [4]
When I did the test I was horrified at how easy it was: I scored 480, and really ought to have scored 500. It certainly seemed to me that the test was pitched at a bright 14 year old, or a reasonably sound 15 year old.
References (because why the hell not?) –
[1] OECD (2013), OECD Skills Outlook 2013: First Results from the Survey Of Adults Skills (pp63-67 give an overview of what adults can do at each of the five assessed literacy levels; pp75-78 do the same for numeracy; pp 87-90 do likewise for problem-solving)
[2] OECD, “The OECD Programme for the International Assessment of Adult Competencies (PIAAC)” , 2010 (boring methodological document)
[3] Rammstedt et al (2013) “PIAAC 2012: Overview of the Main Results” (p5 gives the mapping from raw test scores to the 5 assessment levels; p9 gives the median score/PIAAC level for each OECD country; p7-8 give examples of test criteria for the different levels).
[4] OECD (2012) PIAAC: Key Facts about the Survey of Adult Skills”
So, by saying “hottest year ever” they are trying to hide the decline that has happened between 2004 and 2012… a decline of about 0.28°C or 0.50°F. This is equal to 0.35°C (0.63°F) per decade.
RTF
A icy blast passed over south east Australia last night with winds up to 160km/h.and there was up to 20cm of snow from Lithgow to Katoomba and all rail and road access was closed. Temperatures dropped to zero Centigrade. Tim Flannery was reported to be hiding under his bed in case anyone asked him when the Global Warming was coming.
The revenge of “melting Antarctica”.
Thank you for calling the help line Flim-Flam. Men with flaming torches and pick axes are on their way.
After having been caught altering the Keeling curve in his book (carefully erasing evidence of Agung and Pinatubo’s CO2 amelioration), he’ll likely stay under the bed and keep the dust bunnies comfortable!
Steve
have you seen this?
NASA Study Finds 1934 Had Worst Drought of Last Thousand Years
http://wattsupwiththat.com/2014/10/14/nasa-study-finds-1934-had-worst-drought-of-last-thousand-years/
Confirmation of what you’ve been saying for years.
UAH says much the same. Well done.
Ken Stewart
A massive well done to Steve and yourself Ken. 🙂
And, the likelihood of seeing this on the front page of a Fairfax paper is….?