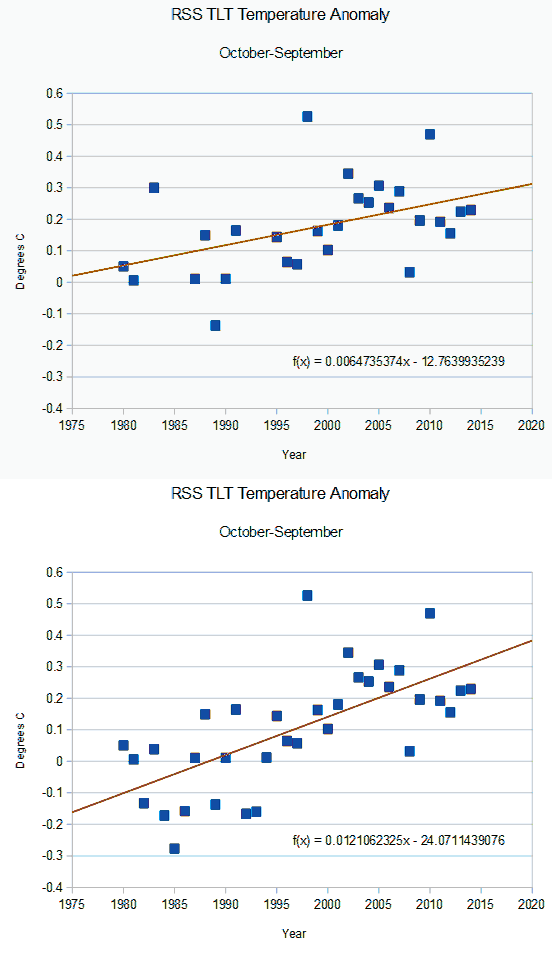
Satellite data shows that the Earth hasn’t warmed much since they were launched in the late 1970s. But it is even “less worse” than that. Besides the fact that the start date of 1979 was one of the coldest years on record in the Northern Hemisphere, two volcanic eruptions on the left half of the temperature graph greatly exaggerate the trend, by artificially cooling the past.
The animation below removes those volcanic years except for 1983 – which I very conservatively adjusted upwards for the super El-Nino which occurred that year, but was masked by dust from El Chichon. As you can see, a realistic evaluation of temperature data shows that there has only been a tiny amount of warming since the very cold year of 1979
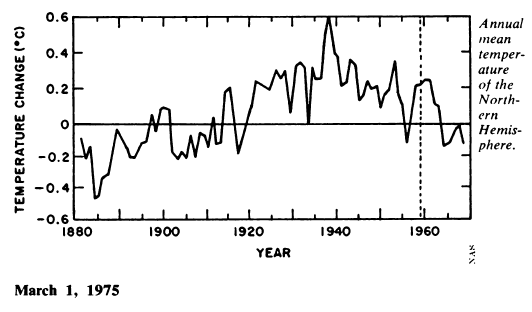
As an extra bonus, in 1975 the National Academy of Sciences showed no warming from 1900 to 1970.
In other words, global warming and the hockey stick is a complete joke, and the people who study it aren’t actual scientists. It is by far the biggest hoax in science history.


Pompous alarmists never engage these points – on the spurious grounds of ‘not giving credibility to deniers’. In reality it’s because they have NO answer to their pet theory and lifelong gravy train being so mercilessly exposed as complete and utter gibberish.
Even when you give them every “legitimate” statistical advantage in the book their theories still don’t hold water (or energy as the case may be.)
I am not in favor of removing data points because that may introduce biases and allows the other side to do the same. Let’s stick to the actual data without changing it or cherry picking.
ZZZZzzzzzzzzzzz………
You forgot the error bars of +/- 1C
(To be fair it is more like +/- 0.1C – http://www.remss.com/measurements/upper-air-temperature/validation )
Which is nothing compared to the surface error bars….
http://www.eike-klima-energie.eu/uploads/media/E___E_algorithm_error_07-Limburg.pdf
David A,
Thanks for the link. This needs a wide distribution. Excellent work.
Over at UK Telegraph they are lamenting how Walrus”s are chasing sea ice north… No real data is given… The implication is that Climate Change is killing the Walrus with exactly ZERO data presented… Garbage..
https://stevengoddard.wordpress.com/data-tampering-at-ushcngiss/
Since it’s now well established that polar bears are not in the dire straits that they were said to be in, it’s time to find some new poster critter…
Unfortunately the walruses won’t do either.
http://polarbearscience.com/2014/10/04/high-walrus-numbers-may-explain-why-females-and-calves-are-hauling-out-in-droves/
The problem is, no matter how much you show the meaning of the real data, no matter how much you refute the wild claims of the Warmunists (I like that term), no matter how correct you are and how well you explain it, the response from the alarmists is and will always be: “So what, we’re winning.”
Politics must be refuted by politics. I hate to say it, but what else works? (My newspaper just a day ago ran a breathless article on “scientists” insisting on AGW causing catastrophic events. The sub-head said “California drought with an asterisk.) These people cannot be convinced, they must be defeated.
Yes, in the words of Uncle (Jackie Chan Adventures)…
“Magic must defeat magic.”
Dead walrus=well fed poly bears
What do you mean they aren’t scientists? Political science is science. It has the word right in the name. Just like environmental science, which, by the way, also has “mental” in the name.
And science fiction writers have ‘science’ in their name, too…so they must be scientists?
Hal Clement, Dr. Isaac Asimov, Dr. Anthony Louis….
I was thinking more along the lines of L. Ron Hubbard…
But you left Arthur C. Clarke off the list of real scientists who also wrote fiction.
mjc, When I mentioned what I had wrote to Hubby, he reeled of a whole list of names.
L. Ron? One of the most successful of con men.
And of course the climate ‘scientists’ do seem to follow L. Ron’s example, don’t they? 😀
I think L. Ron was their inspiration.
In Canada, l’environment has L. Ron right in the name
Now the figures have been reassessed and all is now clear –
https://jaypochapin.files.wordpress.com/2014/09/indecisive-weather-cartoon.png
You know, I look at the numbers and I do have a valid question. Is it warming or is it cooling. I think the honest answer is presently we are cooling, just like the first three decades of my life, I was born in 1953. I think temperature follow a syn-wave with I hope is a moderate warming since we are still emerging from a little ice age! I do now one thing we will not get and honest answer from NOAA or NASA since the sure signs of a scoundrel is one whom rewrites history and both are doing that!
probably cooling. Based on the fact that oranges can no longer be grown as far north in Florida as they used to be.
Can’t remember who did the study or authored the paper, but a recent one from, I think a Scandinavian university, showed that plants respond to changes a lot quicker than previously thought. Like in decades compared to centuries, or even under ten/twenty yrs.
It is actually more of the saw tooth. Faster cooling, then a longer, slower recovery.
I meant to say a moderate warm trend
I have used a slightly different technique to assess the average temperature at during various periods over the satellite era.
http://www.woodfortrees.org/plot/rss/from/plot/rss/from:%201979.4/to:1982.08/trend/plot/rss/from:2001.5/to:2004/trend/plot/rss/from:2010.58/to/trend
By taking the average over a multi-year stretch it eliminates some of the problems of using just one trend line. As you can see the average temperature increased by about .3C over the first two decades and has now cooled by about .1C over the last decade. The leaves a total warming of around .2C. Most of this is no doubt due to the +PDO, maybe all of it.