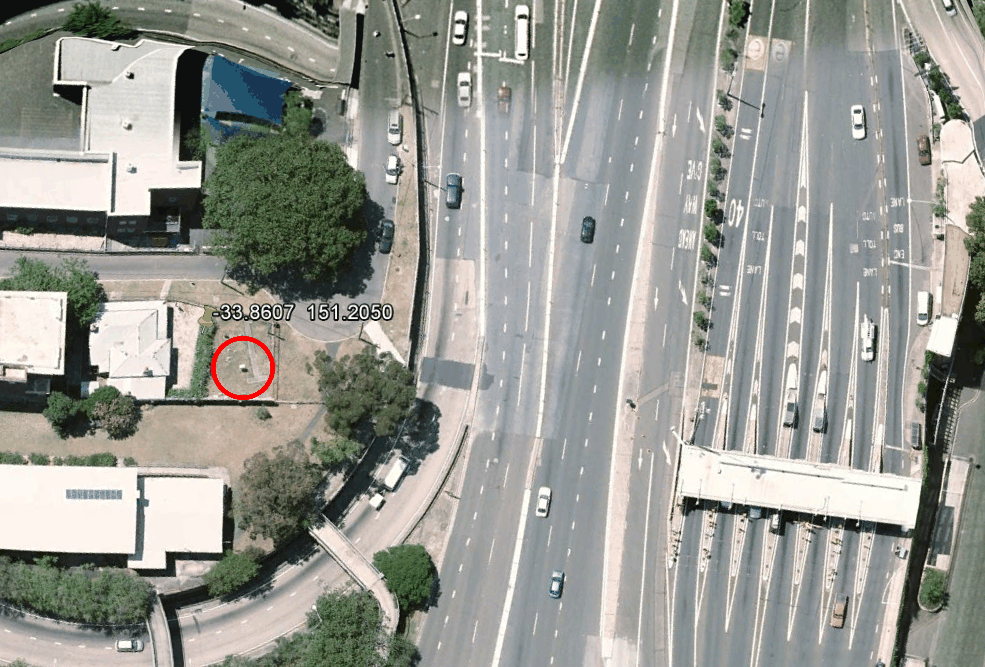
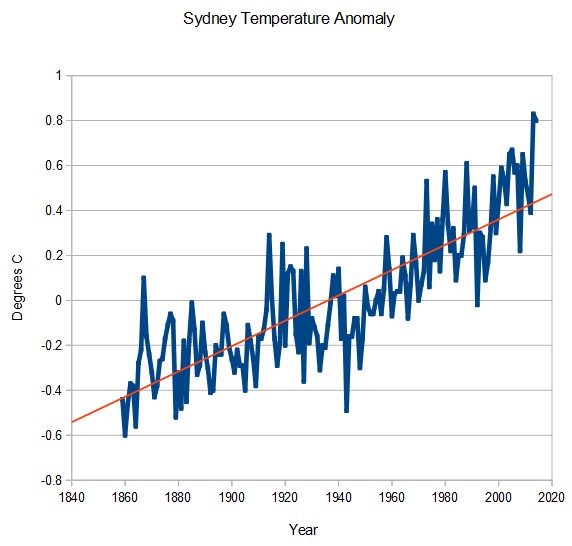
The BOM Sydney thermometer is cleverly located adjacent to 21 lanes of asphalt, and shows a hockey stick of warming.
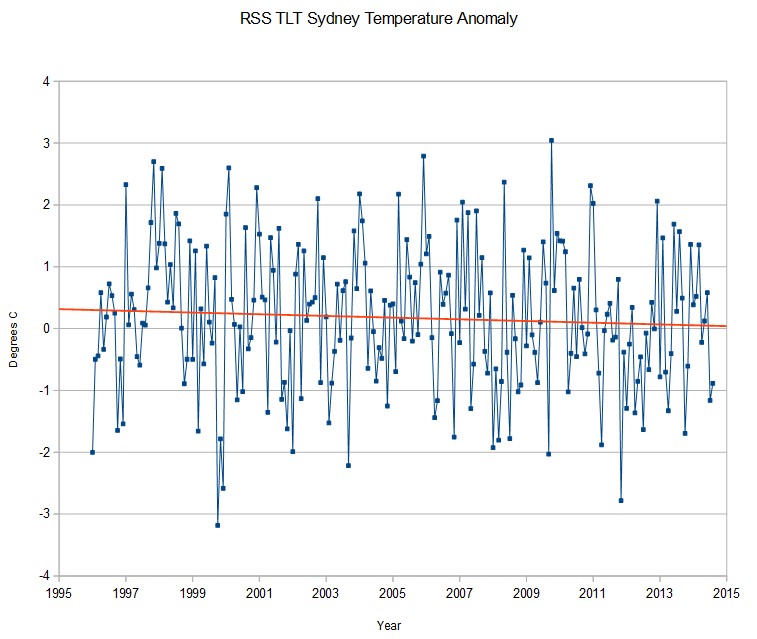
By contrast, satellite temperatures taken of the lower troposphere over Sydney show a slight cooling trend over the last 18 years
BOM then takes the severely tainted urban data, and contaminates surrounding rural stations through a process known as “homogenisation”


maybe they should call their product “Milk Duds”
Hardly surprising. The BoM likes asphalt. If you check their list for the “High Quality” Reference Climate Station (RCS) Network, the vast majority are situated at airports:
http://www.bom.gov.au/climate/change/listing.shtml
At least NCDC acknowledges (i.e. classifies) poor siting; the bad news is that they totally ignore it when ti comes to scaring the crap out of people.
I know that location. It is the southern entrance/exit to the Sydney Harbour Bridge. You may notice a curved road on the left of the photo. That is the entrance from the West (the bridge is roughly North/South) that goes through a 270 degree spiral to get onto the bridge. A lot of fun late at night if there is no traffic …
To be fair, that area has been like that for decades. The bridge was completed in 1923 (from memory).
From the EAST, not West. I am directionally challenged …
It was completed in 1932, when the annual average daily traffic volume (in both directions) was about 10,900. In 2001 it was 159,597 vehicles/day.
http://www.sydneyharbourbridge.info/
Looks like I am numerically dyslexic as well …
It’s raining in Sydney tonight and snowing in the mountains. Quite a lot of snow in the Blue Mountains this year, prolly caused by all the Global Warming, that’d be it.
http://www.smh.com.au/environment/weather/blue-mountains-traffic-blocked-by-snow-and-ice-20140718-zuan2.html
I’ve been meaning to ask why the UHI temperature graphs that Tony has been posting are sinusoidal with a rising trend rather than being sinusoidal with step function increases when a new piece of urban heat island is constructed in the vicinity. The traffic could certainly have something to do with it. It would be interesting to see what the correlation of temperature with traffic is after about 1950.
See Dr Roy Spencer’s work on UHI
http://www.drroyspencer.com/2010/03/global-urban-heat-island-effect-study-an-update/
maybe that scale in C, lol
Australia must be adjusting them faster then rest of earth! http://www.dailymail.co.uk/wires/reuters/article-2927477/Australia-temperatures-rising-faster-rest-world-official-report.html