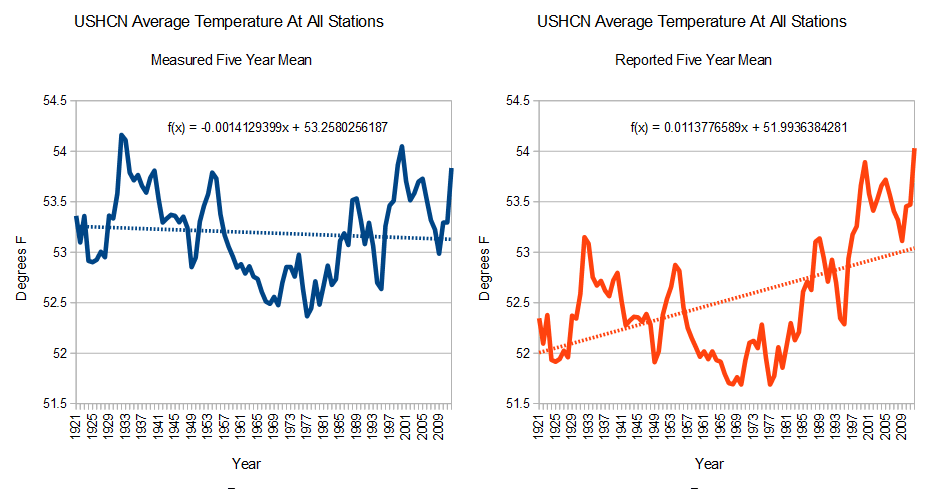
The United States Historical Climatology Network (USHCN) takes records from 1,218 stations around the US, which show the country on a century long cooling trend – as seen in the blue line below. But they alter the data to create a sharp warming trend before they release it to the public – as seen in the red line below.
Measured : ushcn.tavg.latest.raw.tar.gz
Reported : ushcn.tavg.latest.FLs.52i.tar.gz
The animation below shows how they tamper with the data, to create a non-existent warming trend from thermometers which show a cooling trend.
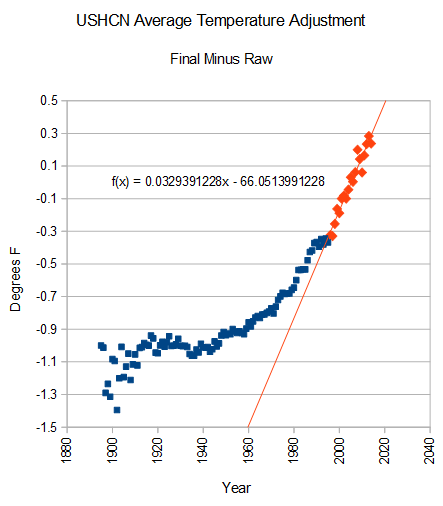
The next graph shows the spectacular hockey stick of data tampering they are doing, which increase US temperatures at a rate of 3.3 degrees F per century since 1997.
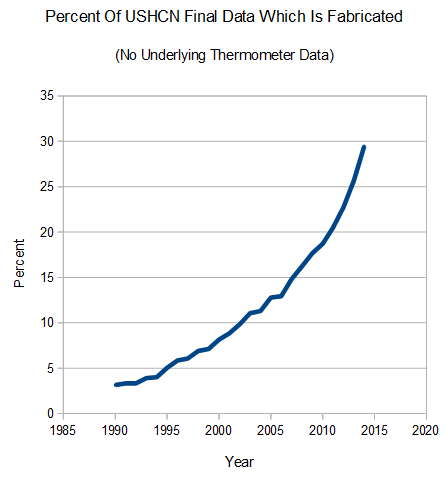
This is bad enough, but it gets even worse. Thirty percent of the temperatures USHCN reports, are completely fabricated, i.e. there is no underlying thermometer data at that station for that month.
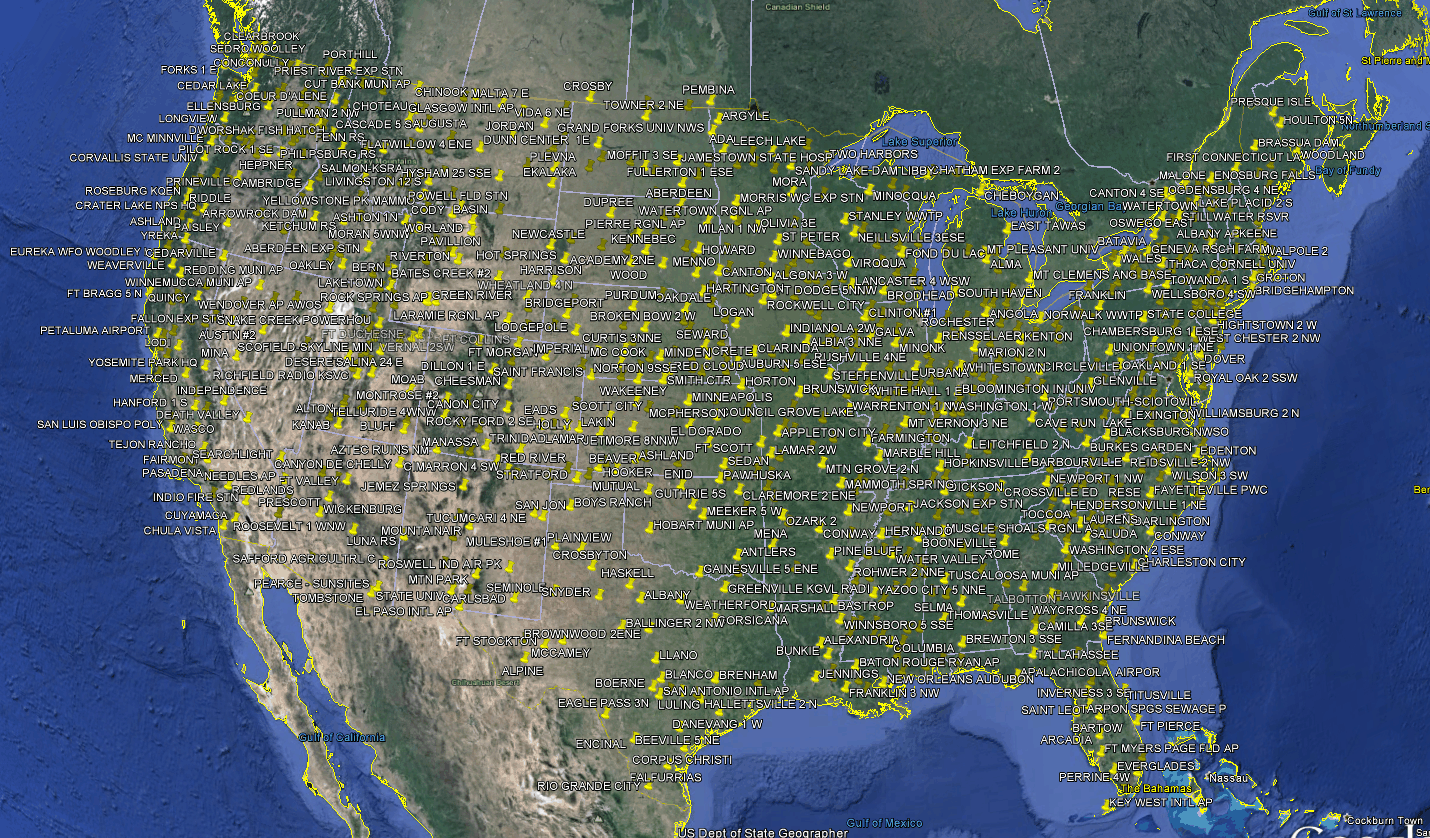
The map below shows stations which have reported temperatures in 2014. They are fairly evenly spaced, and cover the entire lower 48 states.
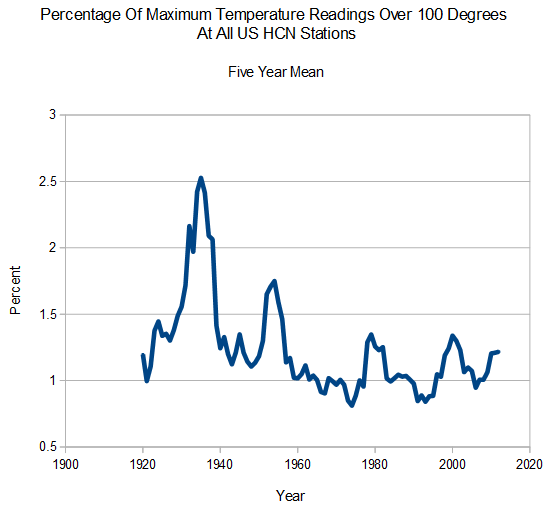
So how do we know that the US used to be hotter? Over the past century, the percentage of maximum temperature readings over 100 degrees has dropped precipitously.
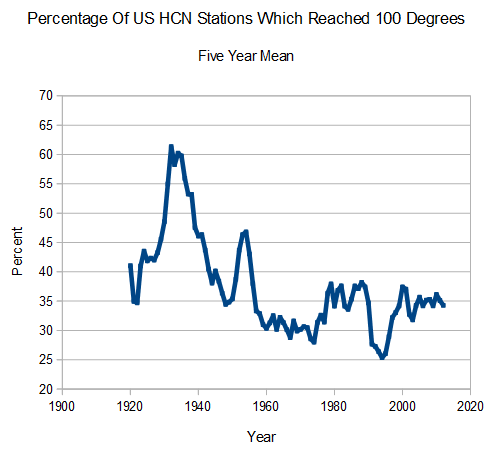
They normally try to explain this away by claiming that time of observation bias (TOBS) causes double counting of past 100 degree temperatures. This is complete BS, as seen in the next graph – which can not be affected by TOBS issues and shows nearly the identical shape.
The bottom line is that the US is cooling, and NCDC is hiding the decline through massive data tampering. They are defrauding the public, legislators and scientists through unjustifiable and incorrect adjustments.
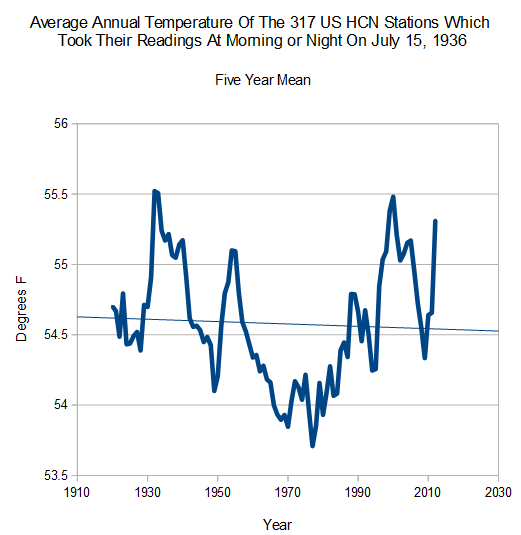
The next graph shows the 317 stations which took their readings either at morning or at night on July 15, 1936. These stations have a warming bias due to TOBS, and would need upwards adjustments in the past. Despite their warming bias, they do not show any warming.


Why don’t you publish this? Maybe I am naive, but what is the reason that Anthony Watts and Steve McIntyre are not interested in this stuff?
Steve McIntyre has done some similar work showing the adjustments. Unfortunately Tom Karl has snowed a lot of people with his theoretical explanations about USHCN adjustments. My goal is to make everyone understand that the actual adjustments being done are not justifiable.
Snowed is right. Moshpup and others refer to papers that alledgedly support the adjustments,. They NEVER go through the code where those adjustments are implemented to justify the actual changes to the raw data!!!
Mosh apparently suggests others read the code, rather than explain why the code is ok. If it’s anything like the BOM’s method in Australia, it’s complete and utter crap. Sadly, alarmists simply reply with “no, it’s not”. It’s rather like telling them it’s less safe to drive on wet roads: they just don’t see the difference.
Dave, what I have seen happen to those with the ability and time to read the code, is they see it is crap and say so, but GISS, NOAA, NCDC, etc. have changed it to use other crap and they have to go through the shit again to get the new crap code and there is never an admission that it was crap in the first place, only that it was good and the new stuff is better.
Steve/Tony . How do USHCN rationalise this or don’t they even feel obliged to explain this.
Is Tom Karl performing some sort of smoke and mirrors that most have not seen beyond
because you are not meant to question the so-called experts anyway as to be against AGW means you want to destroy the planet and are therefore a bad person who should be ignored.
If I try and understand this are they (USHCN) saying that yes absolute high temperatures were more prevalent in the past but overall the body of heat over 24 hours over years was cooler than now.
Looking at WIKI Karl is really an evangelist or revolutionary guard for AGW
http://en.wikipedia.org/wiki/Thomas_R._Karl
I found this rather ironic
“Karl, T.R., R.W. Knight, and B. Baker. 2000. The record breaking global temperatures of 1997 and 1998: Evidence for an increase in the rate of global warming. Geophysical Research Letters 27(March 1):719-722. (press release)”
Hmm so he writes a paper showing evidence for an increase in the rate of global warming just as the pause begins . Maybe he just likes to over do everything, you know, to be sure.
The USHCN adjustments appear to me to be wildly out of line with their documentation.
Anybody wanna play some Hockey Aye?
Mike?
perfect timing with this info, hope Inhofe runs with this soon
Exactly. ;^)
I am interested in the stations not affected by TOBS problems. Where I could find them? How McIntyre could fall for that scam if it’s really that simple to distinguish the stations not affected by the TOBS problem from those that are, and then compare?
These stations exhibit spurious warming due to TOBS, yet do not show any warming.
https://stevengoddard.files.wordpress.com/2014/11/screenhunter_4442-nov-08-22-05.gif?w=640
thank you. this may sound silly, but I am not quite familiar with all the aspects of the problem – why July 15, 1936 is relevant for this analysis? And have all those stations continued to take their measurements in the same way until today?
There has to be a reference date, and that was the hottest week in US history. Nobody takes measurements consistently over time, due to changing land use i.e. UHI.
This is outrageous…. Public Officials are so henpecked by Environmentalists and Progressives that none will take the risk… The criticism of taking this up as an issue…
By Default… And threats… The Left is right… The debate is over…
Time to sue the **** out of the EPA, NOAA, NASA… and states like California who are enacting Public Policy, taxes, and restrictions based on these lies…
Sue Commiefornia??
HAHAHAHAHAHAHAHAHAHAHAHAHAHAHAHAHA
Thank you, Tony Heller (aka Steven Goddard) for having the insight and courage to uncover and report fraud disguised as “consensus science.”
I would not believe my government capable of purposeful deceit until I personally witnessed – and a 1998 CSPAN news video captured – this recording of NASA’s Administrator belatedly releasing 1995 isotope data from the Galileo probe of Jupiter that confirmed a 1983 report of the Sun’s iron (Fe)-rich interior:
https://m.youtube.com/watch?v=m3VIFmZpFco
You are the “Energizer Bunny”. I envy your relentless enthusiasm!
I have a part time job that suddenly became “Full Time” including weekends. I won’t have much free time until after Turkey Day. Keep up the good work.
If Inhofe would run with these figures then the EPA’s Christmas goose will be well cooked.
Except he’s not going to get that chairmanship until January… plenty of time for these guys to start “losing” email and “crashing” hard drives.
tues results tell all, people are waking up finally!
Pretty soon they will change the color schemes so cold will be red and hot will be blue. Can’t?
Back when Reagan won by landslides, television news showed Republican States in Blue and Democrat states in Red. The Media got tired of looking at blue maps, so after Clinton won in 1992, Republican States became Red, just in time for Bush vs. Gore and today we have “red state” “blue state” America. Just to point out it’s been done before.
Why do governments lie? Why do governments use false science to define public policy?
– Trofim Lysenko was responsible for agricultural policies that killed millions of Russians.
– Rachel Carson engineered the banning of DDT that allowed malaria to kill millions in Africa.
– Wealthy nations declared war on fossil fuels making electricity unaffordable for billions of people.
The only explanation that makes any sense is the one provided by Charles Mackay and his “Madness of Crowds”:
http://en.wikipedia.org/wiki/Extraordinary_Popular_Delusions_and_the_Madness_of_Crowds
Unreported CHAOS and FEAR of world-wide nuclear annihilation in AUG-SEPT 1945 frightened world leaders into forming the United Nations in OCT 1945 and forbidding public knowledge of the source of energy in cores of heavy atoms like U and Pu after WWII.
Yes, your electricity prices must “necessarily skyrocket” because…
“The next graph shows the 317 stations which took their readings either at morning or at night on July 15, 1936. These stations have a warming bias due to TOBS, and would need upwards adjustments in the past”
Sorry but my brain is a bit fuzzy tonight, and I do not understand the TOBS bias. I thought they assume it is a warm bias , and so adjust the past DOWN, when the timing of observation created the warm bias (if it did) Any help is appreciated.
Afternoon stations adjust the past down, and morning stations adjust the past up.
Thank your
Thanks Steve for your dogged pursuit and uncovering of this massive fraud by Climate Scientists.. The general public has absolutely no knowledge of this because of political and Media censorship. Your work would be an eye-opener for the average voter.
The other end of the stick is recent satellite measurements of radiation out from the Earth that clearly shows that CO2 does not produce a ‘greenhouse effect’. Not only is temperature not rising at present, but every time it does, extra heat is emitted from Earth, contrary to the ‘greenhouyse/CO2 ‘ theory. This was the original Big Lie that launched the whole incredible Juggernaut of Global Warming..
If you have any time left over, this could be an area for further exposure to the pubic.
:
Will Imhofe and others have the balls to take this on and destroy this hoax for good? Massive fraud and bogus data sets have been foisted on the public by the climate change lobby. If Republicans don’t expose it and root it out, they are not doing their jobs.
He will have to have the balls to take on the National Academy of Sciences.
They are now a formidable foe, with backing from similar organizations worldwide. But sanity will not be restored until we accept reality:
https://dl.dropboxusercontent.com/u/10640850/Solar_Energy.pdf
Please be prepared to have all the data/links on hand to send to the Inhofe/Senate!!! LOL
If someone could walk me through extracting the ushcn data I ‘d appreciate it. Trying to show people the data is legit and would like to make my own graph. Thanks.
http://stevengoddard.wordpress.com/ghcn-code/
Thanks Steve, know you’re busy. Appreciate it.
Er…Tony.
The 1921 data shifts about 1.5 F. If this shift were plotted on a y-axis ranging from min to max none of this would even catch your eye. Everyone is arguing about the size of a pimple on the elephant’s butt.
Except the eco loons have a pact with the politicians that allows that “pimple” to be used to destroy every economy, increase the size of government exponentially, take massive amounts of freedom away from us by increasing law and regulations and the truly unforgivable part, killing millions of poor people by denying billions of them access to reliable, affordable power. The fraud in the records excuse the real and horrible crimes committed in the name of “climate change.”
Well, duh! Not exactly news. So it’s a virulent pimple.
The idea behind the Constitution and a representative republic ruled by laws was to limit the powers the government has and the damage it could do. Words on paper obviously aren’t enough.
We are a Constitutional Republic these days in exactly the same sense that Rome was a Republic about 100 A.D.
I wonder if they keep adjusting the past because they can’t adjust the present due to the USCRN data now being available. They match nicely with the USCRN (2003 onwards) and it is near impossible for them to make adjustments that differ from it without being so obvious that everyone screams fraud. So that leaves them with the pre-USCRN data to fiddle with to fit their agenda. Going forward this will become a larger problem for them.
Good work. Keep it up.
They don’t match at all in recent years. Adjustments are increasing exponentially to hide the decline. They play a game which Zeke described as “current temperatures are always assumed to be correct”
Considering this fact of tampering with the true temperature data, and with global cooling on the way, this is a crime – pure and simple.
It has wasted valuable years for the United States to prepare for global cooling.
Those involved should be held accountable for these crimes against the nation. Pure and simple.
While the next few days are suppose to be very cold, even record setting, I am watching very closely as to whether the New England proverb still holds, ” enough ice before Thanksgiving to hold a duck, nothing there after but rain and muck”.
hi:
Debating USHCN adjustments is a mug’s game. People without commitments to either side can see that they don’t make sense, but the defenders will not accept that without clear, uncontroverible, proof.
Giving them that is both easy in theory and hard in practice: “Simply” compare the recorded data for each station to the derived data published in local newspapers at the time. What you’ll find, as I did for a small sample, is the newspapers report higher temperatures up to about the late 90s and lower ones after that.
My conclusion when i did this was first that it was too much work for me to generalize the result and second that the real data probably does not show a pause – ionly the politically cooked data does. If so, the probable cause of the pause is the greater scrutiny people like Watts put on weather stations and their reports starting in the late 90s.
OOPS! “90s” above should be “60s”. Sorry, fat finger typing problem.
The computer geeks put it succinctly: Garbage in gives you garbage out.