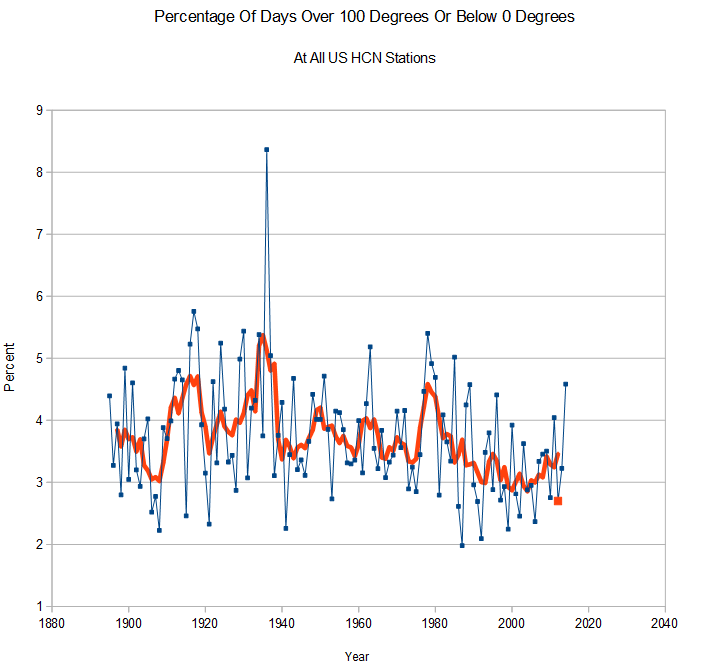
NCDC shows 2012 as the most extreme year in US history, when in fact it was one of the least extreme years in US history.
The graph below is the NCDC graph, showing 2012 as the most extreme year, and 1936 as one of the least extreme years.
The next graph shows the actual percentage of days over 100 degrees or below 0 degrees F. The real graph is basically inverted from the NCDC graph, with 1936 as by far the most extreme year, and 2012 as one of the least extreme years. Extreme temperatures have been on a steady decline for 80 years.
 The level of fraud at NCDC seems to know no limits, with the climate extremes index as the crown jewel of their fake climate data.


The folks at NCDC have become fiction writers. A world of make believe. Maybe a better description would be sci-fi – fantasy
It’s currently 12 degrees here in the Adirondacks. I need the NCDC to come tell me that it’s actually warm, so some of this snow melts.
The graph is not of pure temperature, but of extremes, as defined here: http://www.ncdc.noaa.gov/extremes/cei/definition
The late John von Neumann once said:
‘With 4 parameters, I can fit an elephant. With 5, I can make him wiggle his trunk.’
This graph is created using 6 parameters.
The comparison is of extreme temperatures.
The site says extreme climate, not extreme temperature. This includes drought etc.
They have a separate line for temperature.
And as I showed in the comment below (That you ignored) 2014 has been LOW for:
Drought
Tornadoes
Forest Fires
Hurricanes
Steve showed temperatures so that leaves SNOW!
The components of temperature dominate the graph.
Steve, I am being very sarcastic.
It is obvious that Obummer demanded “Evidence” of Weather Weirding or Climate Disruption or whatever the heck they are calling it now to cover his butt as Ma Nature dumps her wrath on his head and the USA. At this point with temperatures 20F or more below normal across much of the USA and more Arctic blasts on the way he can not use ‘Global Warming’ so he has to use ‘Weather Weirding’ to explain why we are freezing our rumps off and he has to cut our power.
I am sure he will have the EPA closing down more of our coal powered electric so he can drive the USA into third world status as he promised China.
This is all about justifying ramming through the EPA’s June 2, 2014,Carbon Pollution Standards: Clean Power Plan Proposed Rule even though it is completely illogical to do so. The engineers looked at the EPA’s pipe dream and essentially said it is a crock of B.S. but in the nicest way possible.
November 10, 2014 NERC Warns: Time Is Insufficient to Implement EPA’s ‘Clean Power Plan’
Considering we have in 2014 a low number of forest fires, a low number of tornadoes, a low number of hurricanes, low drought and a low Delta T as Steve showed. So it has to be the record high snow that is causing 2014 to be extreme!
Fewest US Forest Fires In Three Decades: https://stevengoddard.wordpress.com/2014/08/28/one-of-the-quietest-summers-on-record-for-us-forest-fires/
As Atmospheric CO2 Has Increased, The Number Of Violent Tornadoes Has Decreased
stevengoddard(DOT)wordpress.com/2014/03/12/as-atmospheric-co2-has-increased-the-number-of-violent-tornadoes-has-decreased/
Hurricanes Set A New Milestone: Today marks nine years without a major hurricane (111+ MPH winds) strike in the US, and nine years without a hurricane strike in Florida. Both are records… ( October 24, 2014)
stevengoddard(DOT)wordpress.com/2014/10/24/hurricanes-set-a-new-milestone/
US Drought Near An Historic Low: https://stevengoddard.wordpress.com/2014/10/18/us-drought-near-an-historic-low/
SO the WINNER is SNOW!
Autumn Snow Cover In A Hockey Stick
stevengoddard(DOT)wordpress.com/2014/10/18/autumn-snow-cover-in-a-hockey-stick/
(Don’t you hate it when Mother Nature kicks a beautiful theory in the butt?)
Without digging into the data, it appears from the definitions that they are overweighting hard rains as twice the impact of severe droughts and heat waves.
No, it is based mainly on extreme temperatures