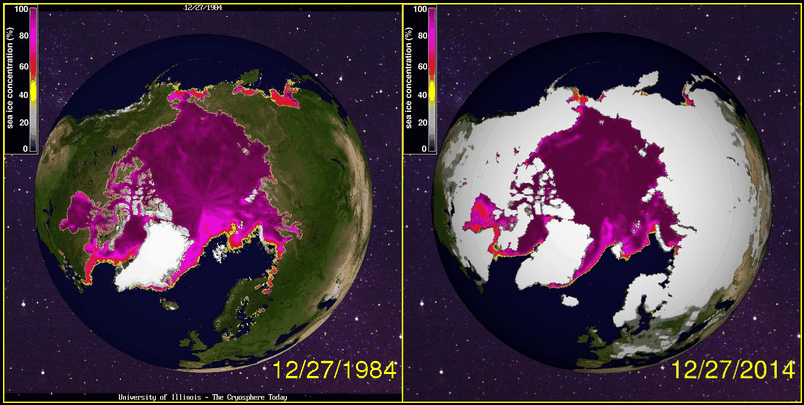
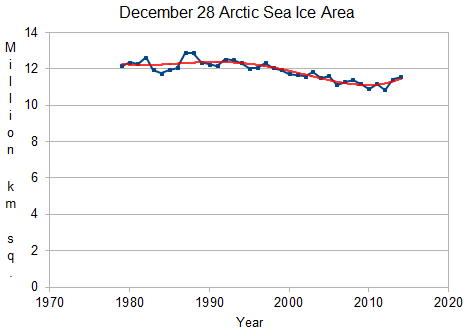
The area of Arctic sea ice is nearly identical to 30 years ago
Arctic sea ice is cyclically returning to the NSIDC cherry-picked date of 1979
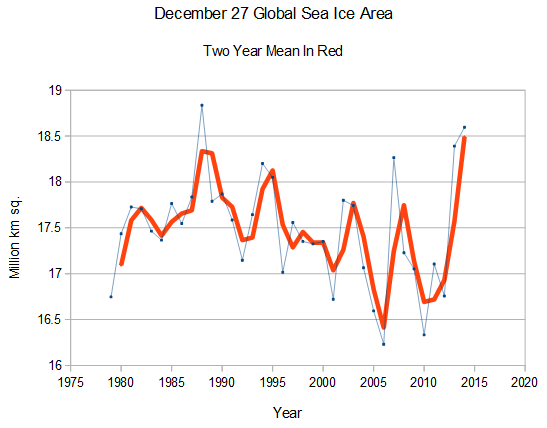
The area of sea ice on Earth has moved into unprecedented territory. When it was declining, they blamed it on global warming. Now that it is increasing, they blame it on global warming.
The amount of solar energy in Antarctica is at its peak for the year, so the record amount of ice is having maximum cooling effect on the planet
All of these things are the exact opposite of what experts forecast. Hansen predicted peak sea ice loss in the Weddell Sea, right where the peak gain has occurred.
Look for them to continue to lie about this for as long as they can get away with it.


Reblogged this on BLOGGING BAD w/Gunny G ~ "CLINGERS of AMERICA!".
Climate experts know everything about climate – except how it works.
So how does 1984 look against 2014 if you take the yearly minimum?
http://igloo.atmos.uiuc.edu/cgi-bin/test/print.sh?fm=09&fd=15&fy=1984&sm=09&sd=16&sy=2014
I would love to see a debate between you (Tony) and somebody from NOAA/NASA/NCDC. I’d even pay for it on pay per view. 🙂
Thank you, Steven, for your courage and persistence in identifying government lies disguised as consensus science.
Joseph Stalin emerged victorious from unreported CHAOS and FEAR of nuclear annihilation in Aug-Sept 1945 [1] to establish the United Nations on 24 Oct 1945 and recruit geophysicists to lay the foundation for the “Red Matrix of Deceit” on two LIES [2]:
1. Neutrons attract, rather than repel, other neutrons
2. Stars burn, rather than make, interstellar hydrogen
The Scientific Revolution began in 1543 with Copernicus’ publication of the “Fountain of Energy” that sustains the Earth-Sun system and ended in 1945 with the “Red Matrix of Deceit” that obscured the source of energy in the Earth-Sun system [3].
Joseph (Vissarionovich) Stalin died on March 5, 1953 but his legacy lives on in the current global climate crisis. World leaders and leaders of the scientific community that deceived the public for the past sixty-nine (2014-1945 – 69 yrs) years are now themselves trapped in the “Red Matrix of Deceit”, unable to address precise experimental data [3] that expose their lies and afraid to admit their roles in deceiving the public for fear of retaliation.
Please use your talents as the most effective critic of the global warming scam, to help world leaders and leaders of the scientific community find a way to escape the “Red Matrix of Deceit” so they can fulfill their responsibility to help society live with “a stormy star” [4].
1. Aston’s PROMISE & WARNING (12 Dec 1922); Unreported CHAOS and FEAR (Aug 1945) https://dl.dropboxusercontent.com/u/10640850/CHAOS_and_FEAR_August_1945.pdf
2. WHY Did Our Government Deceive Us? https://dl.dropboxusercontent.com/u/10640850/WHY.pdf
3. “Solar energy,” Advances in Astronomy (submitted 1 Sept 2014) https://dl.dropboxusercontent.com/u/10640850/Solar_Energy.pdf
4. Curt Suplee, “The Sun – Living with a stormy star,” National Geographic (July 2004) http://magma.nationalgeographic.com/ngm/0407/feature1/index.html
The New Year is an appropriate time to celebrate the end to sixty-nine (2014 -1945 = 69) years of totalitarian rule by Joe’s little geophysicists.
What is also interesting here is that 1979 was not only the beginning of the satellite record but it was the end of a 30-year global cold period (Arctic ice maximum). We just went thru a 20-year global warm period (Arctic ice minimum), so the comparison is between now and 1979 between an Arctic ice maximum and Arctic ice minimum and they aren’t much different.
1979 was not the beginning of the satellite record. The current type of data being gathered goes back to 1974. I know weather satellite data collection goes back to 1966 as I was personally involved in getting the programs my company was writing under contract to the computing facility at Goddard Spaceflight Center. The programs were on BIG decks of punched cards. The programs were copied to tape and then run on one of the IBM 360’s at the facility. I took the printouts, which were crude weather maps made using printer characters back to the office to be checked by the programmers. Before I left the company in 1967 that contract was completed.
The 1979 start of data on the Arctic was chosen to lend support to the AGW scam, as Tony Heller has pointed out before. I seem to recall that there is an effort underway to read satellite data from the early era to help shed light on Arctic ice conditions.
The raw NIMBUS data starting in 1964 is at ftp://n5eil01u.ecs.nsidc.org/ under DP0. There is a ton of stuff on this FTP but I’ve never had the time to get through it nor to even begin to get useable data from here.
Which file under DPo?
Why not link to the appropriate file?
“The current type of data being gathered goes back to 1974.”
Does this mean that there are uninterrupted records (compatible with the later series) going back to 1974?
Obviously the data you gathered from 1966 to 1974 would have to be massaged quite a bit to integrate into the later records.
(1990) IPCC FAR (AR1) WG1 Chapter 7
http://i255.photobucket.com/albums/hh154/crocko05/SeaiceextentIPCCAR1_zps93416e03.jpg
James – your last statement is correct. The ice extent parameters have changed.
The graph that BruceC posted from the 1990 IPCC report (page 224) is based on a 10% coverage, while the current NSIDC parameter is 15%.
Reblogged this on Climatism.
It’s good to have the snow cover represented in the more recent graphic.
All that work, and we are right back where we started. How depressing. 😉
Stupid polar bears don’t need ice. They’re classified as marine mammals and can swim great distances. Many also live on land other than ice caps.
Nevertheless: http://www.dailymail.co.uk/sciencetech/article-2738653/Stunning-satellite-images-summer-ice-cap-thicker-covers-1-7million-square-kilometres-MORE-2-years-ago-despite-Al-Gore-s-prediction-ICE-FREE-now.html
But I heard it will be the hottest year in “recorded history.”
RRRIiight,
Someone forgot about the ‘1940s’ blip and the dustbowl.
The dustbowl years were hot in the US, not globally.
When solar activity decreases the increased temperature in the stratosphere and after a few days, the temperature rise at the surface of the Arctic Circle.
http://www.cpc.ncep.noaa.gov/products/stratosphere/strat-trop/gif_files/time_pres_TEMP_MEAN_OND_NH_2014.gif
http://www.ijis.iarc.uaf.edu/seaice/extent/Sea_Ice_Extent_v2_L.png
Wave appears in the lower latitudes and cold air is pushed out to the south.
http://www.cpc.ncep.noaa.gov/products/stratosphere/strat-trop/gif_files/time_pres_WAVE1_MEAN_OND_NH_2014.gif
Ok, so they are claiming that both the air surface and water surface temps are rising? Should there not be a corresponding spike in atmospheric CO2 as warmer oceans are not able to hold as much of that gas?
Yes, they have the relationship backwards. The temperatures of the oceans control the amount of CO2 in the atmosphere and not the other way around.
So as the oceans warm then they should be releasing a measurable amount of CO2 into the Atmosphere?
Text written by Professor. Walter Jensen Chemol project and adapted Marlene
Rau and Andrew Brown.
“Carbon dioxide (CO2 relative molecular weight: 44.01) is a colorless,
odorless and non-flammable gas. Its density is 1.977 g / l (at
0 ° C) and the melting point of -57 ° C (at a pressure of 5185 bar).
The solubility of carbon dioxide increases with the pressure of 100 parts of water
dissolved 171 parts of carbon dioxide at 0 ° C, 119 at 10 ° C, 88 at 20 ° C,
75.7 at 25 ° C and 27 at 60 ° C. For example, 1 liter of CO2 dissolved in 1 liter of water (in
room temperature) at a pressure of 1 bar (normal pressure
air); 2 liters of CO2 at 2 bars; 3 l at 3 bar, and in 4 l at 4 bar. solution
water is slightly acidic because 0.1% of dissolved carbon dioxide molecules
reacts with water.”
Bubbles that we drink in mineral water is not carbonic acid.
I have seen this trend recently, people using the good names of others but the numbers they show are fake, fake, fake. I am all for freedom of anything, but the originator of such blatant lies, should be prosecuted and imprisoned for life, my opinion. Free speech is vital, it allows exchange of ideas, and of course people who believe or repost are innocent of intentional harm. This originates from the extraction industries, if anyone ever decided to put everything together you would clearly see what I mean.
After a second look. Is this sea ice area or sea ice extent?
http://nsidc.org/arcticseaicenews/faq/#area_extent
http://nsidc.org/arcticseaicenews/
Look at the Dec graph at the above link.
It doesn’t agree with the assessment here.
Gives a Dec ’14 ave of 12.5 and that for ’84 was ~13.2 (10^6 km^2) with a quite alarming long-term decline.
Too true when will all the brainwashed that are called the so called intelligent human race see through all the beurocratic bullshit all the leaders spew each day to them to cover up the fact that all they want to do is find new ways off fining, taxing and just plane stealing from them I don’t know the average intelligence off most people can’t be more than about 30 just barely above functioning level I believe all spastics??????