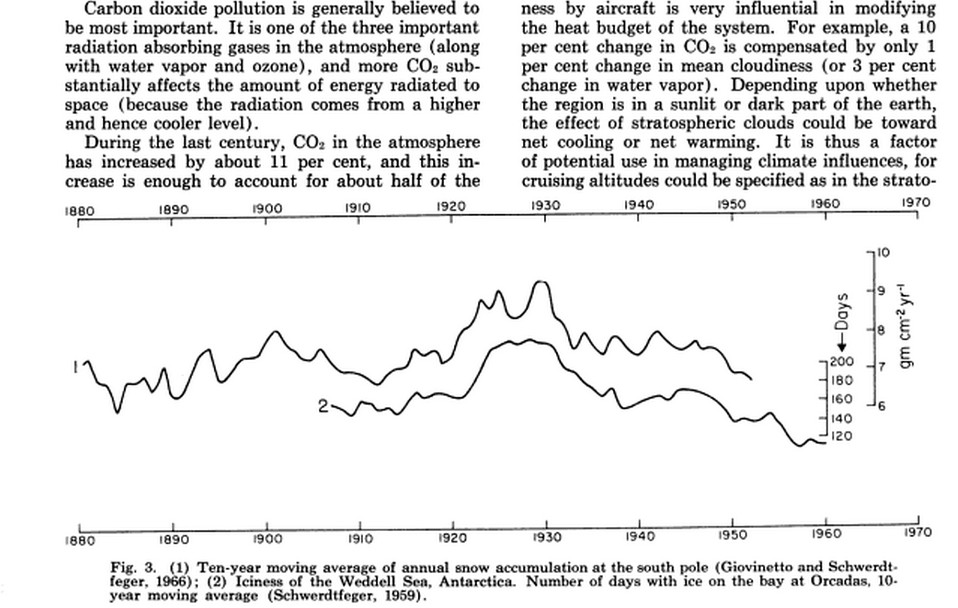
In 1970, scientists blamed low Antarctic sea ice extent on CO2.
Now they blame high Antarctic sea ice extent on CO2.
NOAA said in a news release Tuesday that “as counterintuitive as expanding winter Antarctic sea ice may appear on a warming planet, it may actually be a manifestation of recent warming.
NOAA: Record Antarctic Sea Ice Growth Linked To Its Staggering Loss Of Land Ice | ThinkProgress
If the ice wasn’t changing, that would also be blamed on CO2.


It is the God Molecule. CO2 is omnipotent.
Amen.
They are upset that the counter argument (commonly referred to as the “denier” or “skeptic”) is receiving funding in Australia –
http://www.smh.com.au/environment/call-for-pynes-resignation-over-4-million-funding-to-climate-contrarian-20150417-1mnp51.html
Reblogged this on the WeatherAction News Blog and commented:
The theory that explains everything, explains nothing.
I think I would restate it this way…
The theory that explains nothing, explains everything. 😉
So Antarctic sea ice advances when it’s colder, and declines when it’s warmer? What about the physics?
—–
http://onlinelibrary.wiley.com/doi/10.1002/2014GL059821/abstract
We present the first proxy record of sea-ice area (SIA) in the Ross Sea, Antarctica, from a 130?year coastal ice-core record. High-resolution deuterium excess data show prevailing stable SIA from the 1880s until the 1950s, a 2–5% reduction from the mid-1950s to the early-1990s, and a 5% increase after 1993.
—–
http://www.cgd.ucar.edu/staff/cdeser/docs/fan.antarctic_seaice_trends.grl14.pdf
Apart from the Antarctic Peninsula and adjacent regions, sea surface temperatures and surface air temperatures decreased during 1979–2011, consistent with the expansion of Antarctic sea ice. In contrast, the Southern Ocean and coastal Antarctica warmed during 1950–1978. Sea level pressure (SLP) and zonal wind trends provide additional evidence for a sign reversal between the two periods, with cooling (warming) accompanied by stronger (weaker) westerlies and lower (higher) SLP at polar latitudes in the early (late) period. Such physically consistent trends across a range of independently measured parameters provide robust evidence for multidecadal climate variability over the Southern Ocean and place the recent Antarctic sea ice trends into a broader context. ….. For the Southern Ocean as a whole, sea surface temperature has decreased by approximately 0.6°C in December-February (0.4°C in the annual mean) while Antarctic sea ice cover has increased by approximately 9% in December-February (12% in the annual mean) during 1979-2011.
—–
http://www.ipcc.ch/ipccreports/tar/wg2/index.php?idp=599
Another analysis of a 21-station data set from Antarctica by Comiso (1999) found a warming trend equivalent to 1.25°C per century for a 45-year record beginning in the 1950s but a slight cooling trend from 1979 to 1998. The slight cooling trend for this later 20-year period also was confirmed via analysis of surface temperatures over the whole continent, as inferred from satellite data.
—–
http://journals.ametsoc.org/doi/abs/10.1175/JCLI-D-11-00496.1
A 125-yr ice core record of climate from the Whitehall Glacier ice divide provides exceptionally high-resolution stable isotope data from the northwest margin of the Ross Sea, Antarctica. Reconstructed mean annual temperatures show no significant change between 1882 and 2006. However, a decrease in cold season temperatures of ?1.59° ± 0.84°C / decade (at 90% confidence) is observed since 1979.
The perfect amount of ice was during the Holocene Optimum 3,300, 6.800 and 7,800 years ago. There was much less of it.
Reblogged this on Climatism.
Slightly north of Antarctica – Valle Nevado (Chile) ski season is also due to CO2. If only skiers would stop using fossil fuels to get to the mountain, or maybe pay a snow bunny tax which would save the snow bunnies. Webcam shows 20 cm of April snow with some more to come in the next week or so.
http://www.vallenevado.com/en/information/
Zinlun Zhang 2006 says the increase in sea ice is caused by a decrease in sea ice:
“an increase in surface air temperature and downward longwave radiation results in an increase in the upper-ocean temperature and a decrease in sea ice growth, leading to a decrease in salt rejection from ice, in the upper-ocean salinity, and in the upper-ocean density. The reduced salt rejection and upper-ocean density and the enhanced thermohaline stratification tend to suppress convective overturning, leading to a decrease in the upward ocean heat transport and the ocean heat flux available to melt sea ice. The ice melting from ocean heat flux decreases faster than the ice growth does in the weakly stratified Southern Ocean, leading to an increase in the net ice production and hence an increase in sea ice mass.'”
Do you reckon he is comfortable sitting on that bard wire fence.
Which ever way he decides to fall, he will likely do some serious damage to himself . 🙂
We should celebrate! This guy has discovered a negative feedback loop. He has moved beyond the death spiral.
We are saved.
http://www.esa.int/Our_Activities/Observing_the_Earth/CryoSat/Fast_access_to_CryoSat_s_Arctic_ice_measurements_now_available
3.5m Ice lol
Reblogged this on tannngl and commented:
Too, too much?
They just keep losing their minds.