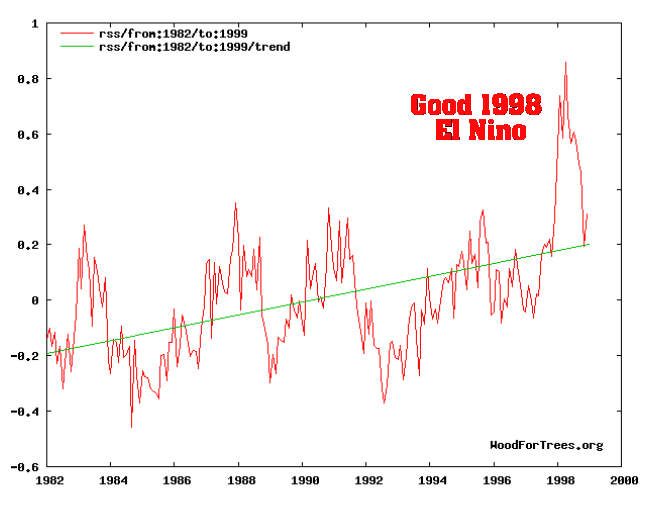
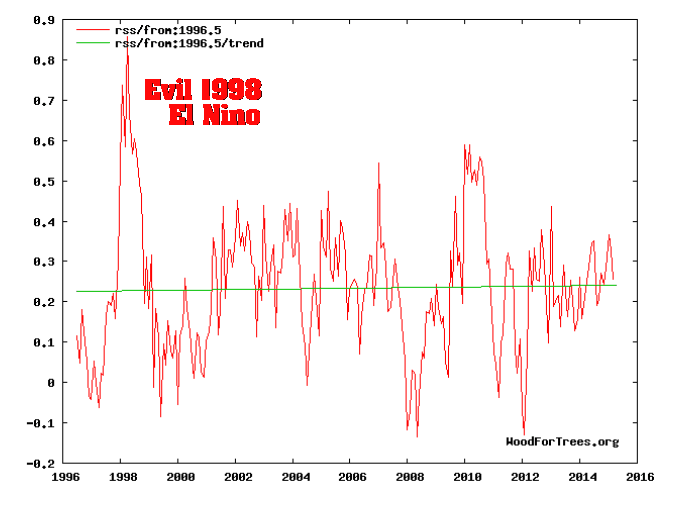
In 1998, the El Nino was hailed by climate scientists as proof that they deserved funding forever. It was like hitting the jackpot at Las Vegas.
But seventeen years later, the 1998 El Nino is now considered evil, an aberration which must be ignored. Ridicule is heaped on anyone who makes a graph which includes the 1998 El Nino.
However, the next El Nino to appear on the right side of the graph will be cited as proof that climate scientists deserve funding forever.


We have to get rid of the 1998 blip.
http://www.woodfortrees.org/graph/gistemp/from:1996.5/plot/gistemp/from:1996.5/trend
http://www.woodfortrees.org/graph/hadcrut4gl/from:1996.5/plot/hadcrut4gl/from:1996.5/trend
Wow… what a trend… I think I have the issue solved.. every time I go outside the Climate Changes… Climate Change is totally dependent on ME!!…
Its cold outside… now its warm inside my CO2 spewing SUV.. Climate Model says its going to stink in a few minutes… yepp… just blew a farrttt and it stinks… methane release caused the microclimate in my SUV to change… temps have shot up …
We have to get rid of ALL ‘blips’ forever. Thus the hockey stick is preserved.
Gavin playing with his models again?
https://www.youtube.com/watch?v=LMxTFqPET5I
You can see that in the 70s AMO index was the lowest value. We remember that the solar cycle was weaker. Now AMO will also decrease faster. I greet Vukcevic.
http://www.vukcevic.talktalk.net/SUN-and-AMO.htm
There are so many hypothesis of what causes natural climate changes, I suspect that the actual case may be a blend of many cyclical events.
For at least a decade scientists in Russia have been strongly projecting a cooling phase.
One unique hypothesis which I think has some merit is that an additional motion of the earth from that which is most familiar to us, is an oscillating motion at right angles to the plane of the solar system. I do not know what the period of the oscillation is hypothesized to be.
Nobody knows. That is why models are crap. Whenever I get a zealot on the line, I ask them to list all climate forcings, order them from most to least effective, and then quantify them.
Turns know-it-alls into blithering idiots.
Underestimated the Sun’s magnetic field changes. It turns out that, depending on the activity of solar greatest changes occurring in range of UV and galactic radiation. Depends on the state of the ozone in the ozone area as well as the distribution of ozone in the stratosphere. Bearing in mind that winter polar vortex develops in the stratosphere it is very important for climate change. In addition, the stronger GCR ionization increases the amount of rainfall.
I am aware of known forcings.
List all climate forcings, order them from most to least effective, and then quantify them
We can add more forcings to Ren’s, but do any of us, as Gator suggests, know the magnitude of any or the period if it is a cyclical oscillation. Even the oceans decadel oscillations are irregular, perhaps caused by other forcings.
There is now talk of ‘stadium waves’ permeating throughout the whole earth system.
“The science is settled’ from a science organization has to be one of the most idiotic and political statements ever stated within the realms of science.
There is this data. https://landscheidt.wordpress.com/2009/01/21/11000-year-c14-graph-lines-up-perfectly-with-angular-momentum-graph/
The orbits of the planets are very predictable, both forwards and backwards in time.
https://landscheidt.wordpress.com/2009/06/04/200-year-solar-cycle-prediction/
Who discovered the El Nino?
https://ams.confex.com/ams/annual2003/techprogram/paper_58909.htm
Interesting stuff, especially the solar issue.
Warm (>+0.5oC; red stippled line) and cold (<0.5oC; blue stippled line) episodes for the Oceanic Niño Index (ONI), defined as 3 month running mean of ERSST.v3b SST anomalies in the Niño 3.4 region (5oN-5oS, 120o-170oW)]. Base period: 1971-2000. For historical purposes cold and warm episodes are defined when the threshold is met for a minimum of 5 consecutive over-lapping seasons. The thin line indicates 3 month average values, and the thick line is the simple running 7 year average of these. Last 3 month running mean shown: December 2014 – February 2015. Last diagram update 6 March 2015.
http://www.climate4you.com/images/NOAA%20CPC%20OceanicNinoIndexMonthly1979%20With37monthRunningAverage.gif
http://www.climate4you.com/images/Ap-Index%20Since199001.gif
Major/strong el Niños becoming less frequent…
There has not been a major/strong El Niño for over 17 years!
Using +1.8 peak as the minimum, 3-month-season, and counting from the start year of the El Niño
1957, +1.8, then 8 years
1965, +1.9, then 7 years
1972, +2.1, then 10 years
1982, +2.2, then 4 years
1986-88, +1.6 BUT it lasted 19 months/2 seasons … then 9 years
1997, +2.4, then 17 and still counting…
17+ year without a major/strong El Niño is puzzling.
El Niño index very clearly decreasing since 2005.
Circulation does not indicate El Niño.
http://www.cpc.noaa.gov/products/analysis_monitoring/enso_update/sstanim.gif
Ah YES!! …. Continually diminish the past while hyping high temperatures TODAY!!… Brilliantly evil… continues the funding forever…
Just as Tony has shown us all on this Blog… constant barrage and hysteria from 100+ years ago… reads the same as the shit put forth today… “Earth Warming”… “Changes at the Poles”… “Sea Level Rising”… same shit… going back a hundred years… yet we’re all still alive… Manhattan is not under water..