
There has been some confusion about the human component of sea level rise, so I thought I would clear that up once and for all.
NASA scientists have also learned that CO2 turned John Cleese into a newt.
There has been some confusion about the human component of sea level rise, so I thought I would clear that up once and for all.
NASA scientists have also learned that CO2 turned John Cleese into a newt.

Holy See rise, Badmann!
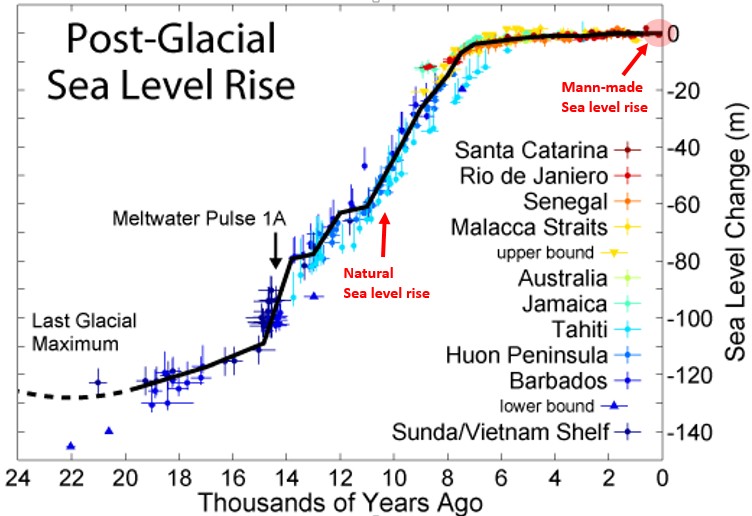
An honest evaluation of sea level rise from tide gauge data yields a rate of a little over 2 mm/yr for the last 30 years. It also turns up an acceleration of about 0.02 mm/yr². IF that were to remain constant, it would result in a rate of almost 4 mm/yr by 2100 and a total rise of about ten inches.
The satellite data which doesn’t appear to be honest as the overall rate has been consistently bumped up over the last ten years stands at 3.2 mm/yr or 2.9 mm/yr if you disregard the GIA bump-up. However since 1992 the satellite record displays a negative acceleration rate of about -0.05 mm/yr². IF that were to remain constant sea level would rise no more than four inches by 2080 and then begin to decline.
Faced with the embarrassing fact that sea level is not rising nearly as much as has been predicted, the University of Colorado’s NASA-funded Sea Level Research Group has announced it will begin adding a nonexistent 0.3 millimeters per year to its Global Mean Sea Level Time Series. As a result, alarmists will be able to present sea level charts asserting an accelerating rise in sea level that is not occurring in the real world.
http://www.forbes.com/sites/jamestaylor/2011/05/11/nasa-funded-group-doctors-sea-level-data/
alarmists will be able to present sea level charts asserting an accelerating rise in sea level that is not occurring in the real world.
No they can’t. The CU Data
http://sealevel.colorado.edu/files/2015_rel1/sl_ns_global.txt
can be used to show acceleration:
The rate from 2003.9544 26.978 to 2014.9494 70.758 is 2.97 mm/yr
and the rate from 1992.9595 -5.774 is 3.54 mm/yr
It follows that (2.97 mm/yr – 3.54 mm/yr) ÷ 11 yrs = (-0.05 mm/yr²)
The alarmists can assert all they want, but as I’ve shown, and as anyone with a high school education and an Excel spreadsheet can figure out, the accelertion rate according to the satellites since 1992 is negative.
Steve, Good, accurate and important point—and as you said anyone with
high school education and maybe not necessarily a an Excel spreadsheet.
For us old guys who used slide rules, and kept the decimal floating in our head.
I think that indoctrination into arithmetic/ math has been a life long benefit. It prevents
one from getting fooled easily.
Steve, Steve, Steve, we should all know by now that the alarmists can “assert” anything they like, as they do so on an hourly basis. 😉
Hey Gator, that is true, BUT
that is why we must make sure we continually arm ourselves with
as much knowledge as possible, give caveats when needed and eventually
the tide will turn.
The alarmist position did not happen overnight and neither will the tide change in the
other direction quickly.
Here, I will state where I think the science (only the science) really is.
There may be some CO2 caused warming, but much smaller than models show, if any at all. Natural changes are the main cause.
Also, it is rarely brought up that CO2, as Roy Spencer states, is an elixer of life.
It would seem the benefits far out weigh any possible negative effect if any.
I was a climatology student right after the ice age scare, and before the great global warming swindle. CO2 does have a warming effect, but additional CO2 does not have a detectable effect at current levels.
http://joannenova.com.au/globalwarming/graphs/log-co2/log-graph-lindzen-choi-web.gif
The narrative of a 3.0 transient climate response for a doubling of CO2 just will not go away.It was kind of an average of all models.
Gator, even the alarmists state, but it is not often considered that the temperature response to CO2 increase is not linear. but is rather to a doubling, assumed to be doubling from anyone point.
Their models incoporate positive feedback loops, they know that CO2 warming is logarithmic.
NASA scientists have also learned that CO2 turned John Cleese into a newt.
No they didn’t.
I too can be sometimes humor impaired. So just in case you couldn’t actually figure it out for yourself … Tony was NOT being serious with that newt assertion. The NASA scientists are not actually smart enough to figure that out.
He got better.
Now, what about our Olympic Decathlon champion.
Oh-oh, I better not go into the politically incorrect humor
Unless of course I do it on Saturday Night Live.
SNL stopped being funny when they went PC. Your non-PC humor is welcome here. 😉
https://www.youtube.com/watch?v=V2b21yAeEpQ
And they claim race relations have improved. Bullsh*t.
But that is what there computer models ‘projected’. And everyone knows they are never wrong.
their
It helps to be literate.
Sea level rise on this planet is 1.41 mm per year and is accelerating at 0.00000 %
http://tidesandcurrents.noaa.gov/sltrends/sltrends_station.shtml?stnid=1612340
What continent is Hawaii on?
Morgan, you are correct in that data for Hawaii
The difficult thing about sea level rise calculation is the fact that it is much different in various locations.
Because most land is on plates kind of floating on molten material. some areas are rising and some are falling, that is in some areas there is larger sea rise and in some the sea is sinking.
There are also atolls.that form and then disappear. Also changes in ocean currents
cause tides to be higher or lower in some locations.
All of this is why, when data is cherry picked by alarmists, those of us who keep getting more skeptical keep getting more and more and more skeptical and upset if decisions effecting the entire planet.are based on false narratives.
No kidding. Why are you talking about continental plates and atolls when I specifically used Hawaii for those obvious reasons?
Hawaii is currently over a hot spot bump. Get a good undersea floor map and you will see a line of little spikes leading off to the NW, all the way to the Pacific Plate subduction zone. The big island is currently going up or just at the top of the bump.
The south-eastern Vietnamese coast is tectonically stable.
Mid to late Holocene sea-level reconstruction of Southeast Vietnam using beachrock and beach-ridge deposits
Of course to get around this evidence (and get the paper published) Karl Stattegger et al had to add this “get around the evidence” paragraph:
However they do put in the highlights”
Back to Hawaii:
Sea-level highstand recorded in Holocene shoreline deposits on Oahu, Hawaii
The Hawaiian Islands take millions of years to pass over the hot spot, that spot has been there for millions of years and the motion of each island is 10000000000 times too slow to be relevant to any argument you might be concocting as to why it can’t be a reliable place to measure accurate sea level rise over the course of a century. Your argument is just dumb. I am totally sick of stupid arguments, I really can’t take it anymore.
CO2 may have turned Cleese into a newt, but too bad CO2 could never turn Hansen into a Newton.
The witches brew is C02 + government funding. It can turn any scientist, no matter their field of expertise, into grantologists. It can also turn politicians into a Newt…
https://www.youtube.com/watch?v=qi6n_-wB154
Only the most gullible Dem voters believe sea levels rising in Biscayne Bay is caused by fossil fuels or “global warming.” Why aren’t sea levels rising on the ocean side of Miami Beach, or other parts of Florida at higher rates than normal, then? Rates are the same since the last ice age, except where groundwater use is high and the ground sinks, making sea levels rise faster in some locales everywhere.
A: Biscayne Bay is at the juncture of gov’t meddling between canals carved to bring water from Lake Okeechobee, artificial islands carved for shipping channels and ports in Miami, and the Intracoastal Waterway to increase waterfront property values (and local tax revenues) right there. Yes, the federal Army Corps of Engineers is why, not the Koch Bros. But you can’t get a gov’t funded “climate change” grant if your science blames the gov’t. And Obama says the private sector “didn’t build that” — except in Marco Rubio’s back yard it must be the Koch’s fault.
Sea levels rise rates are the same along the ocean side, including Pacific coast, and other natural causes affect sea levels all over the world (in Scandinavia the sea level has been FALLING
for ages, even though it’s next to the “melting” Arctic and Greenland ice caps, due to natural fluctuations in the Earth’s crust between ice ages. Conversely, sea levels rise more where the crust sinks more such as along US mid-Atlantic, when last ice age recedes, until next one begins.
Steve is using a graph of sea level from WIKI. One problem is the sea level data is not raw data but adjusted data.
If you look at this graph, you see that if you remove the red outlier the sea level has fallen over the last two thousand years. The red outlier is attributed to Santa Catarina.
http://upload.wikimedia.org/wikipedia/commons/1/1e/Holocene_Sea_Level.png
Looking for a sea level study done in Santa Catarina, I found this paper:
The next question is Brazil tectonically stable?
The Brazilian Shield is tectonically stable. The last orogenic cycle to affect it occurred > 600 million years ago.
Any uplift is extremely slow.
Campo Formoso is in the state of Bahia in the North-East region of Brazil. Lagoa Santa is in the mid region inland and a bit north ofRio de Janeiro on the east coast and Santa Catarina is on the coast south of Lagoa Santa.
The second problem is the earth has been cooling since the Holocene optimum, glaciers have re-established and the sea level has really FALLEN.
<b.TEN STUDIES PROVING SEA LEVEL IS NOT RISING:
https://stevengoddard.wordpress.com/2015/03/08/the-cant-find-the-missing-water-and-it-is-a-travesty-that-they-cant/#comment-499786
Sea level rise is just another Warmist lie based on cherry picking the time frame and the studies used.
One problem is the sea level data is not raw data but adjusted data.
Once data has been adjusted, it is no longer data, it is an artifact of analysis.
The grantologists point to artifacts, and claim it as data.
da·ta ?dad?,?d?d?/ noun
1- facts and statistics collected together for reference or analysis.
ar·ti·fact ?ärd?fakt/ noun
1- an object made by a human being…
I strongly agree with you Gator. With sea level rise, if the area is not tectonically stable all you can do is guess.
Gail and Gator, living in a particularly tectonically stable part of the world I can say that over the last 70 years, benchmarks of mine that are accurate to at least an inch, show no SLR but in fact some fall [up to 12 inches in some cases].
I’m using highest astronomical tides at normal barometric pressure which show practical SLR, not tide gauges which show changes in MSL.
Thank you for some independent validation.
The amount of lying and adjusting and covering up of data is truly amazing! —A huge effort— no wonder so many billions have been spent bribing scientists to lie. It is also sickenning and frightening. How much else has been deliberately falsified? Makes you think we are living in George Orwell’s 1984.
The temperature record across the world has been corrupted as has been show by Tony and others.
Dr Zbigniew Jaworowsk has shown how the CO2 record has been corrupted.
The sea level records have been corrupted.
Even the plant biology of CO2 has been corrupted to bring it in line with the corrupted ice core data. I used to have a link, since removed from the internet.
From my old notes:
The interesting thing is the revisionism at work. The ice core data shows time periods of CO2 = 180 PPM yet the C3 plants did not all die out.
In my old notes from ~ 2007 I found “ under 200 pm CO2 trees starve” http://biblioteca.universia.net/ficha.do?id=912067
but the link no longer works… Now all the searches turn up papers showing 180 ppm or lower….HMMMmmmm
I then check a couple of studies in 2010 and found the 180 -200 ppm CO2 for trees is now based on “models” derived from the ice cores. GRRRrrrr
Here is an example of a recent search (2011):. Notice the obvious answer to the question posed, that the ice core data is flawed as Dr Zbigniew Jaworowski stated** is never even entertained as a possibility.
‘How much else has been deliberately falsified? Makes you think we are living in George Orwell’s 1984.’
If I can’t trust you with my ex girlfriend I can’t trust you with my children.
ABSTRACT: 20th century accumulated greenhouse gasses due the the release of sequestered carbon dioxide as a result of anthropogenic activity, has caused a dangerous rise in sea level in the United Kingdom. A small but measurable trend in adaptive specie modification has been observed in certain English population subgroups (excepting the Welsh and Scots since they are incapable of evolving). Amphibian attributes such as webbed digits and primitive gill structures are present in pub surveys and in the House of Commons. John Cleese has recently asserted the he has known he was a newt since childhood and will begin surgical transition to full newthood with the help of doctors at the NHS. We assert that this phenomenon is caused by human induced climate change. We believe the incidences of newtism will continue to increase if more extreme carbon dioxide mitigation polices are not adopted in the near future.