The graph explains the climate science definition of weather vs climate.
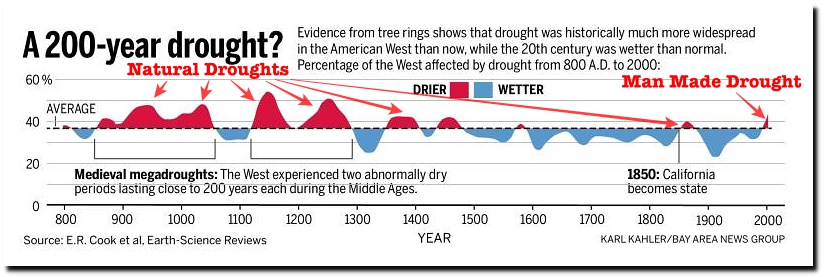
For climate scientists, a three year California drought which suits their funding needs is climate, but 1,200 years of drought history is data that needs to be erased or altered.
Repent and be saved sinner!
You and your kids are sinners, sinners, sinners!
YOU caused the drought and the “dry rain” won’t stop it!
Give up your cars, your paychecks, live the nil life, repent, repent!
(and send your money to us)
Haaa, Haaa, Haaa,
Could type that with a straight face.
Never make it as a “religiously believe” Calif boss person.
Well Tony; you and CW certainly have some weather headed your way. GFS showing 8″ or so of snow and the European showing up to 2 feet of the white stuff! All this while Washington DC is having temps in the high 80’s and low 90’s and your friends out here in the Midwest are enjoying ideal weather until the tornadoes come. BTW May is usually the month with the highest tornado incidence.
Note in the chart that the US-west was developed (think irrigation and related water planning) when there were long periods of high precipitation. Thus, those folks thought the west was a wetter place than has subsequently been determined*. Water laws are based on first-use and the amounts were over allocated. Indian rights, large cities, and Salmon restoration have entered the fray. What a fine kerfuffle.
[*And dangerously seismic – unknown when Seattle and the rest of Puget Sound area began building things.]