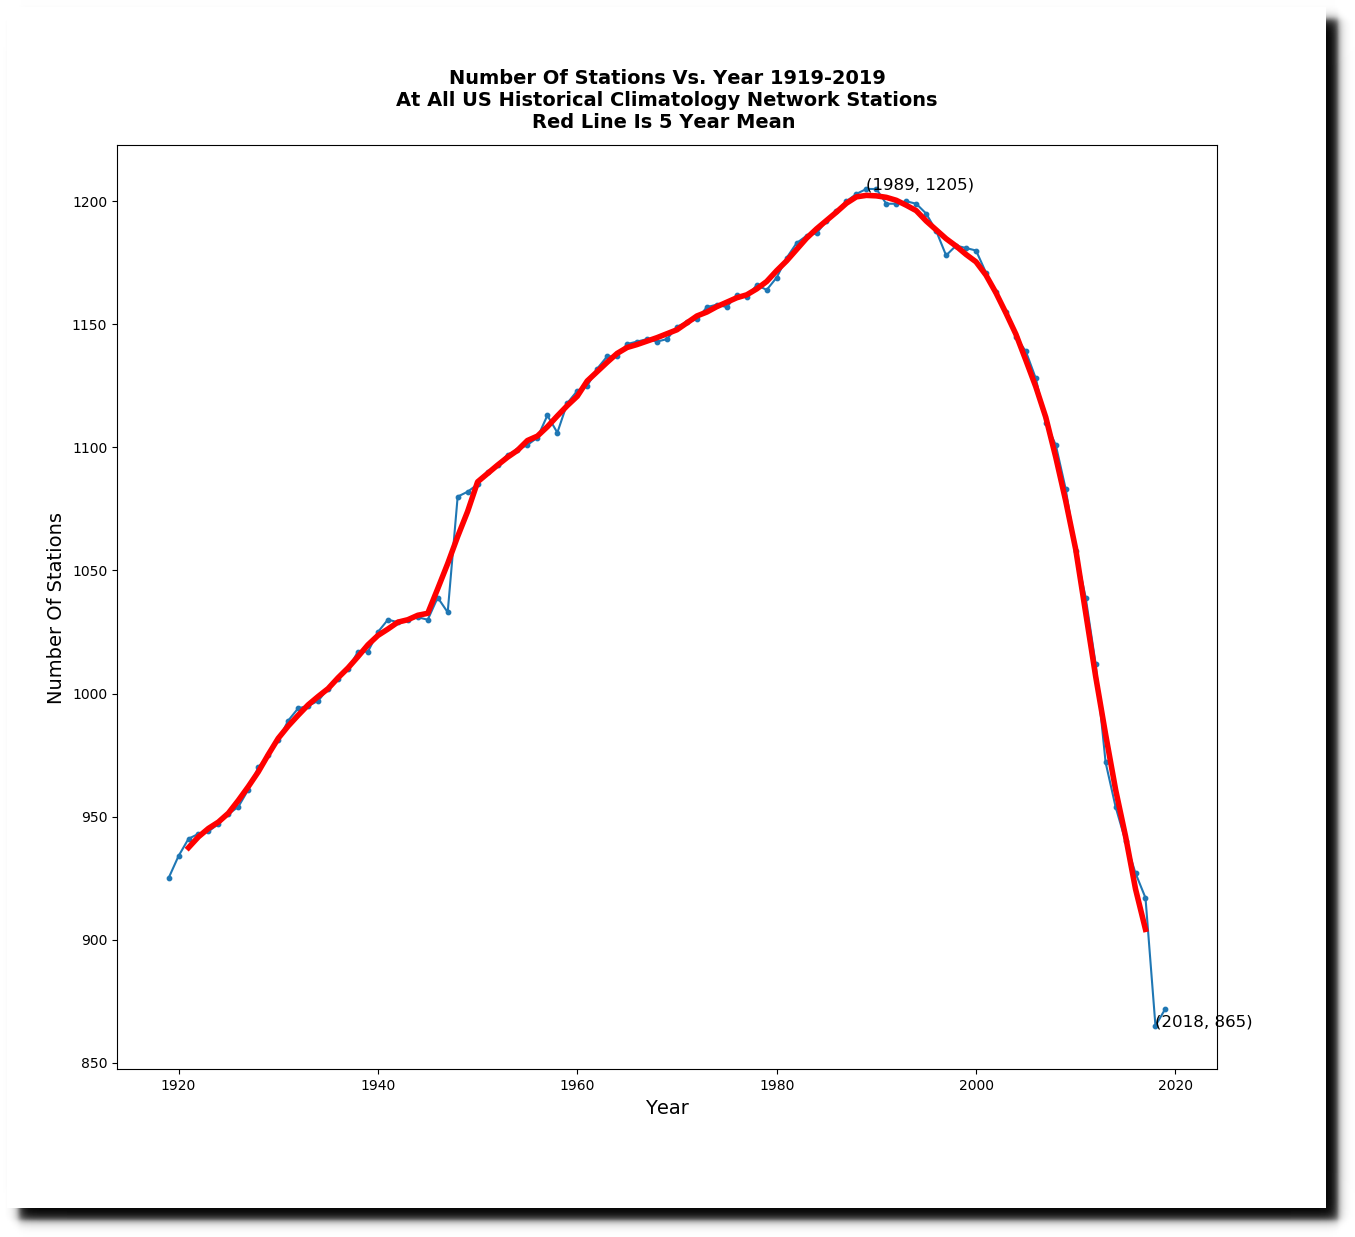
Over the past 30 years, NOAA has been rapidly losing US thermometers. In 1989, 1,205 stations reported some daily temperatures, but last year only 871 stations reported some daily temperatures.
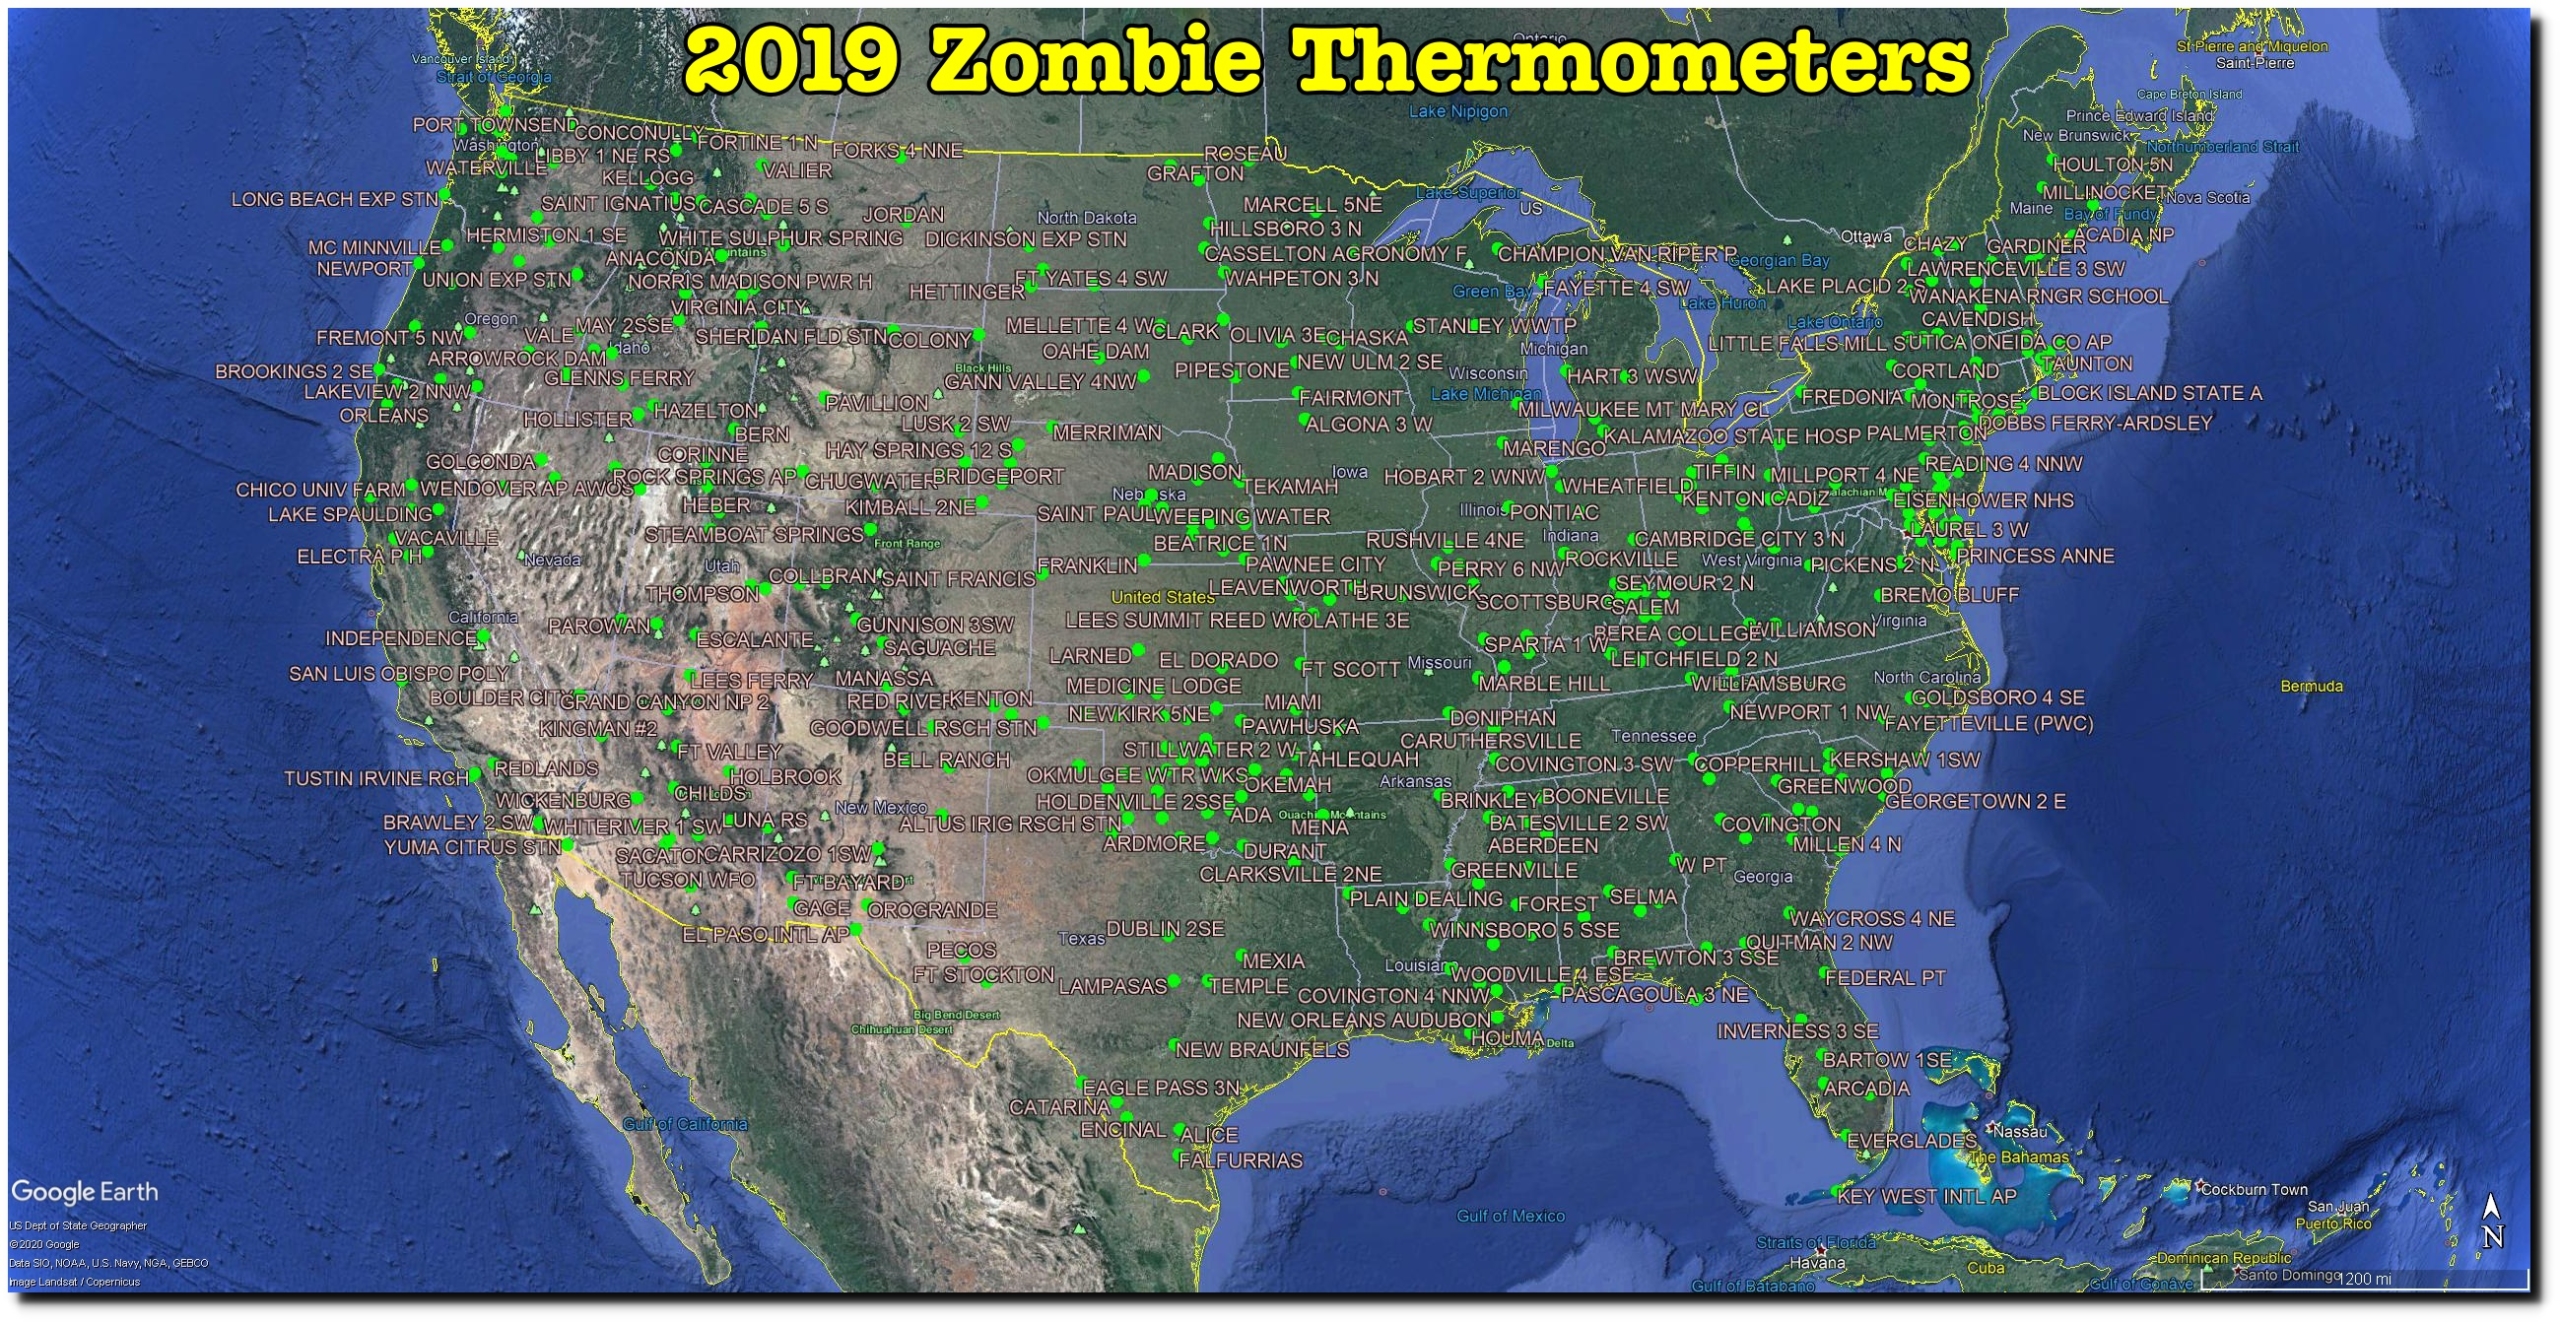
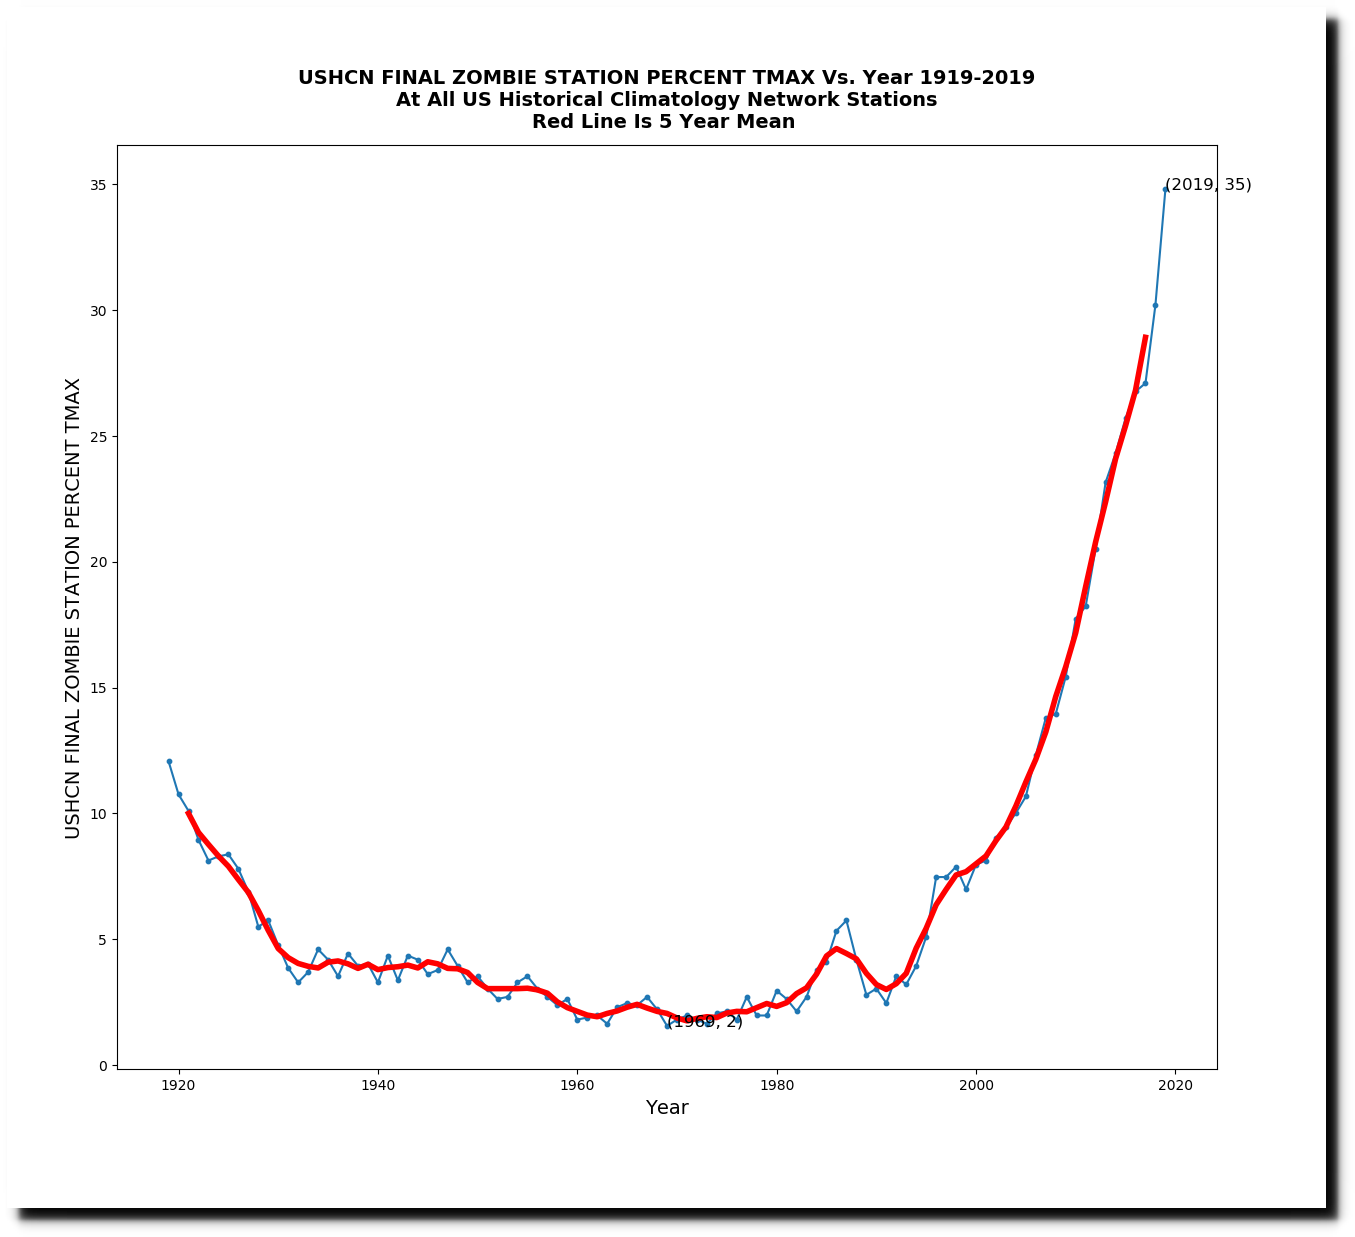
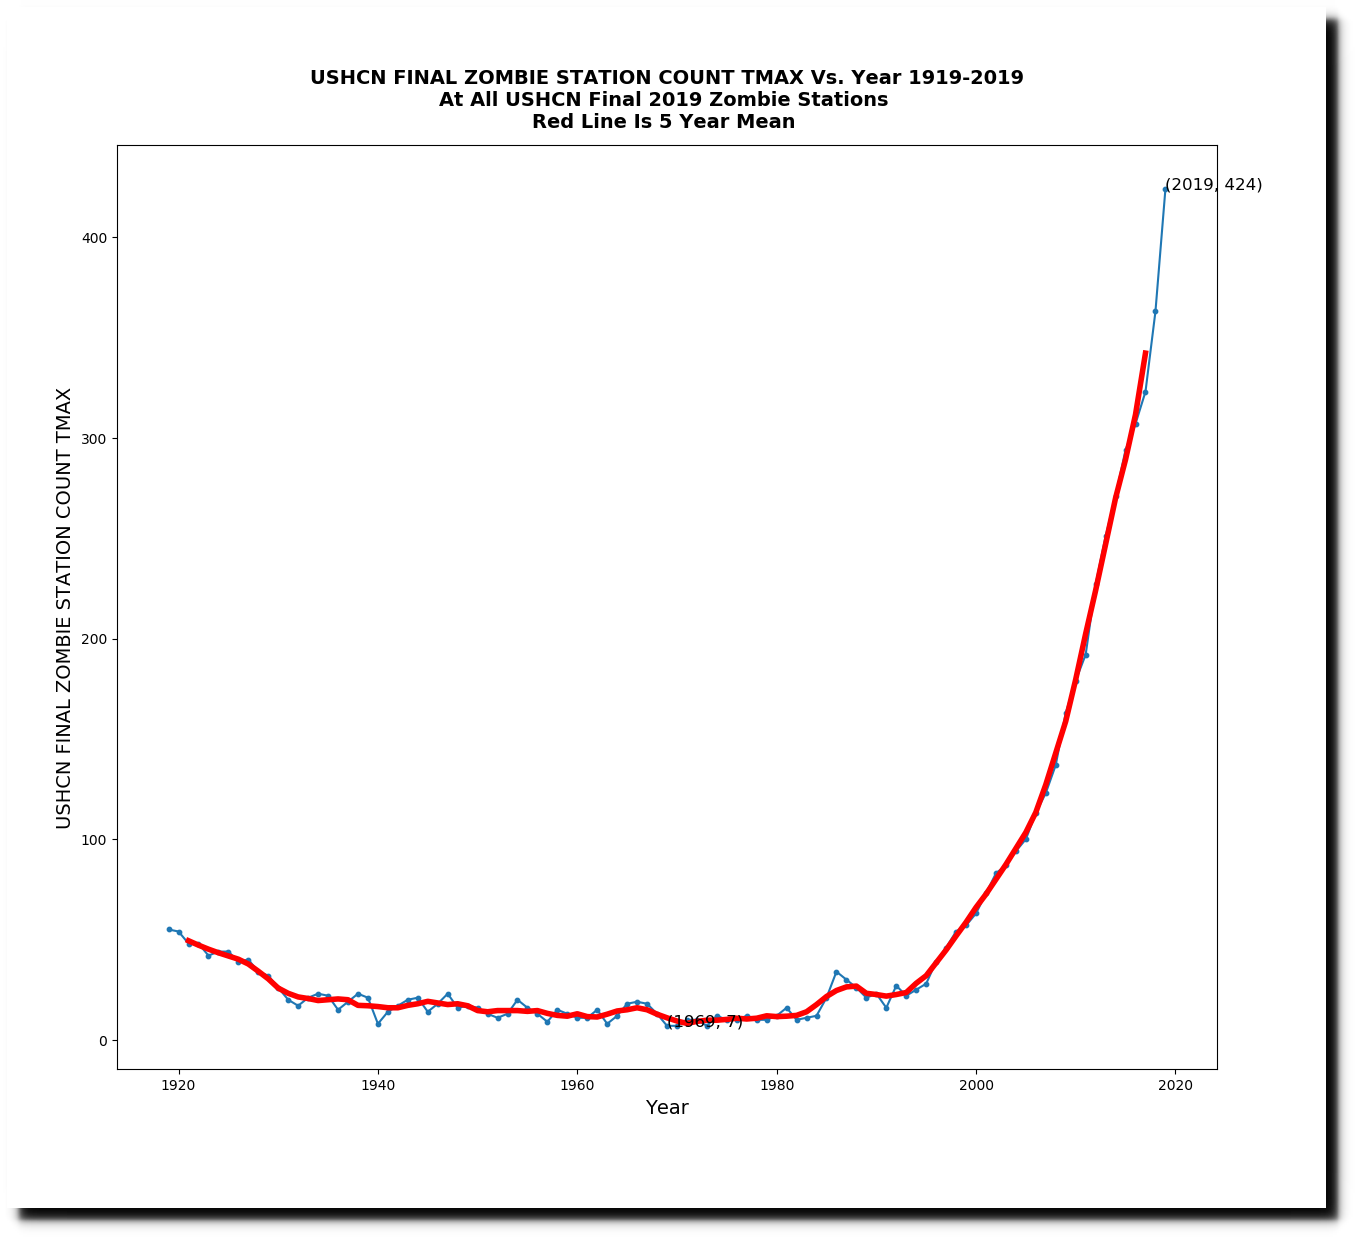
Thirty-five percent (424) of the stations in 2019 were zombie stations, meaning that NOAA estimated data for all twelve months. This is done even for some of the thermometers which reported at least a little data in 2019.
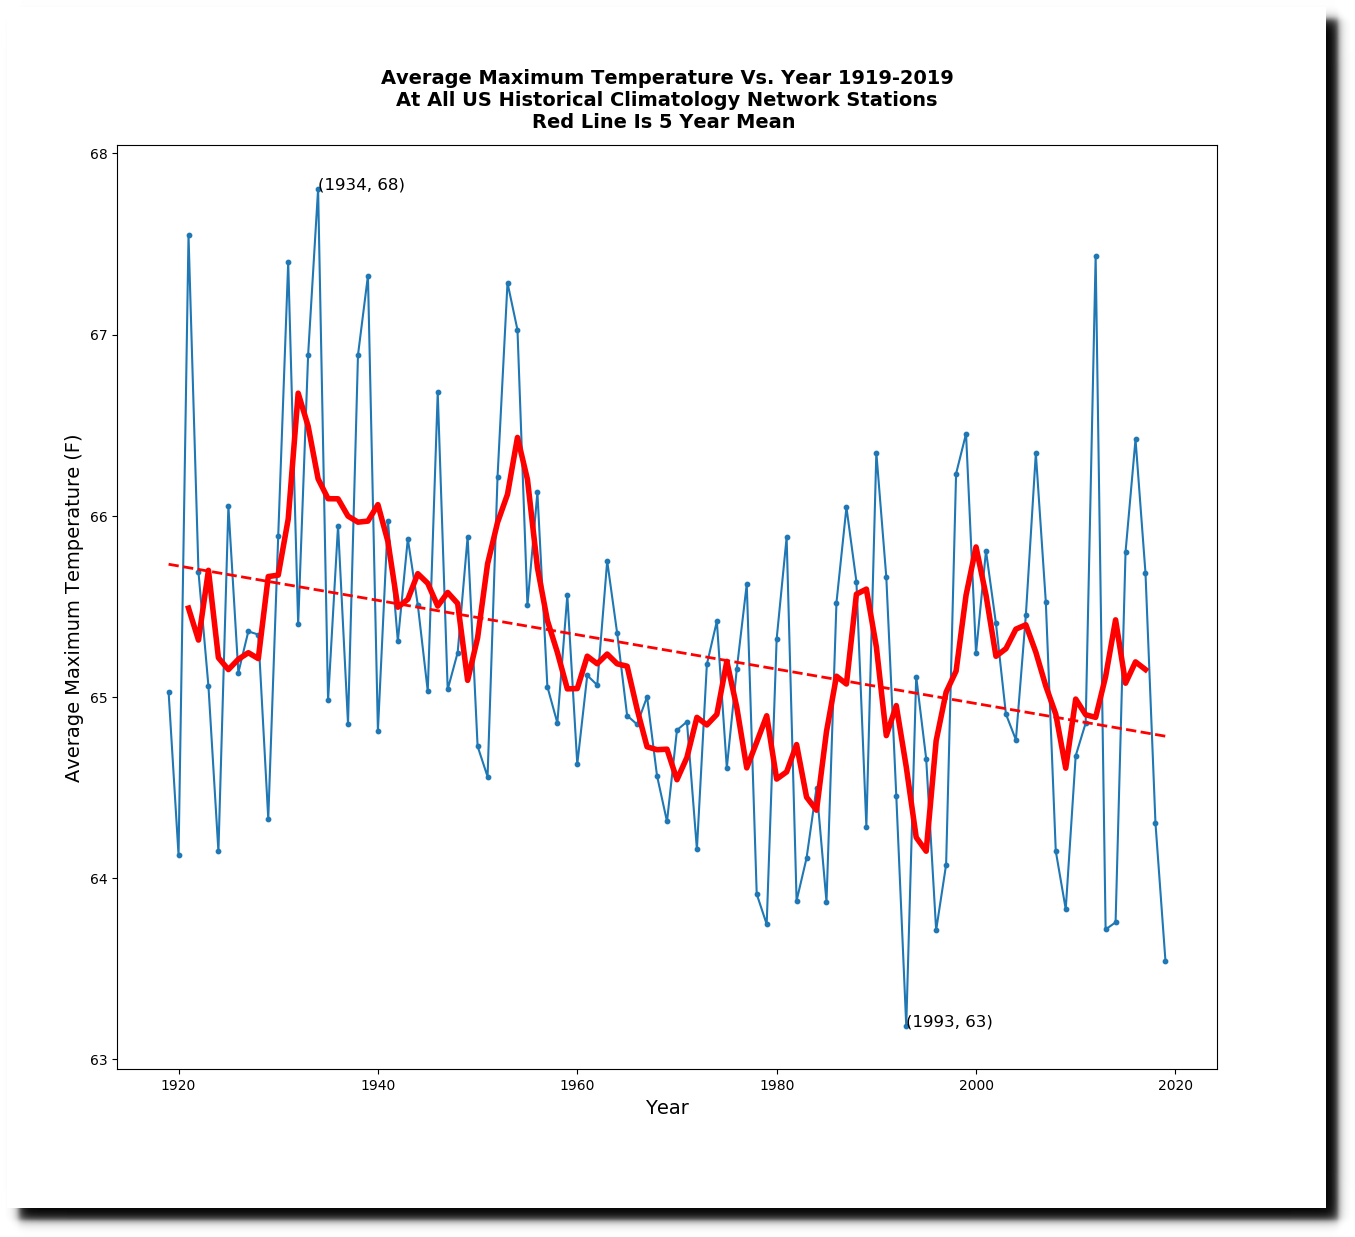
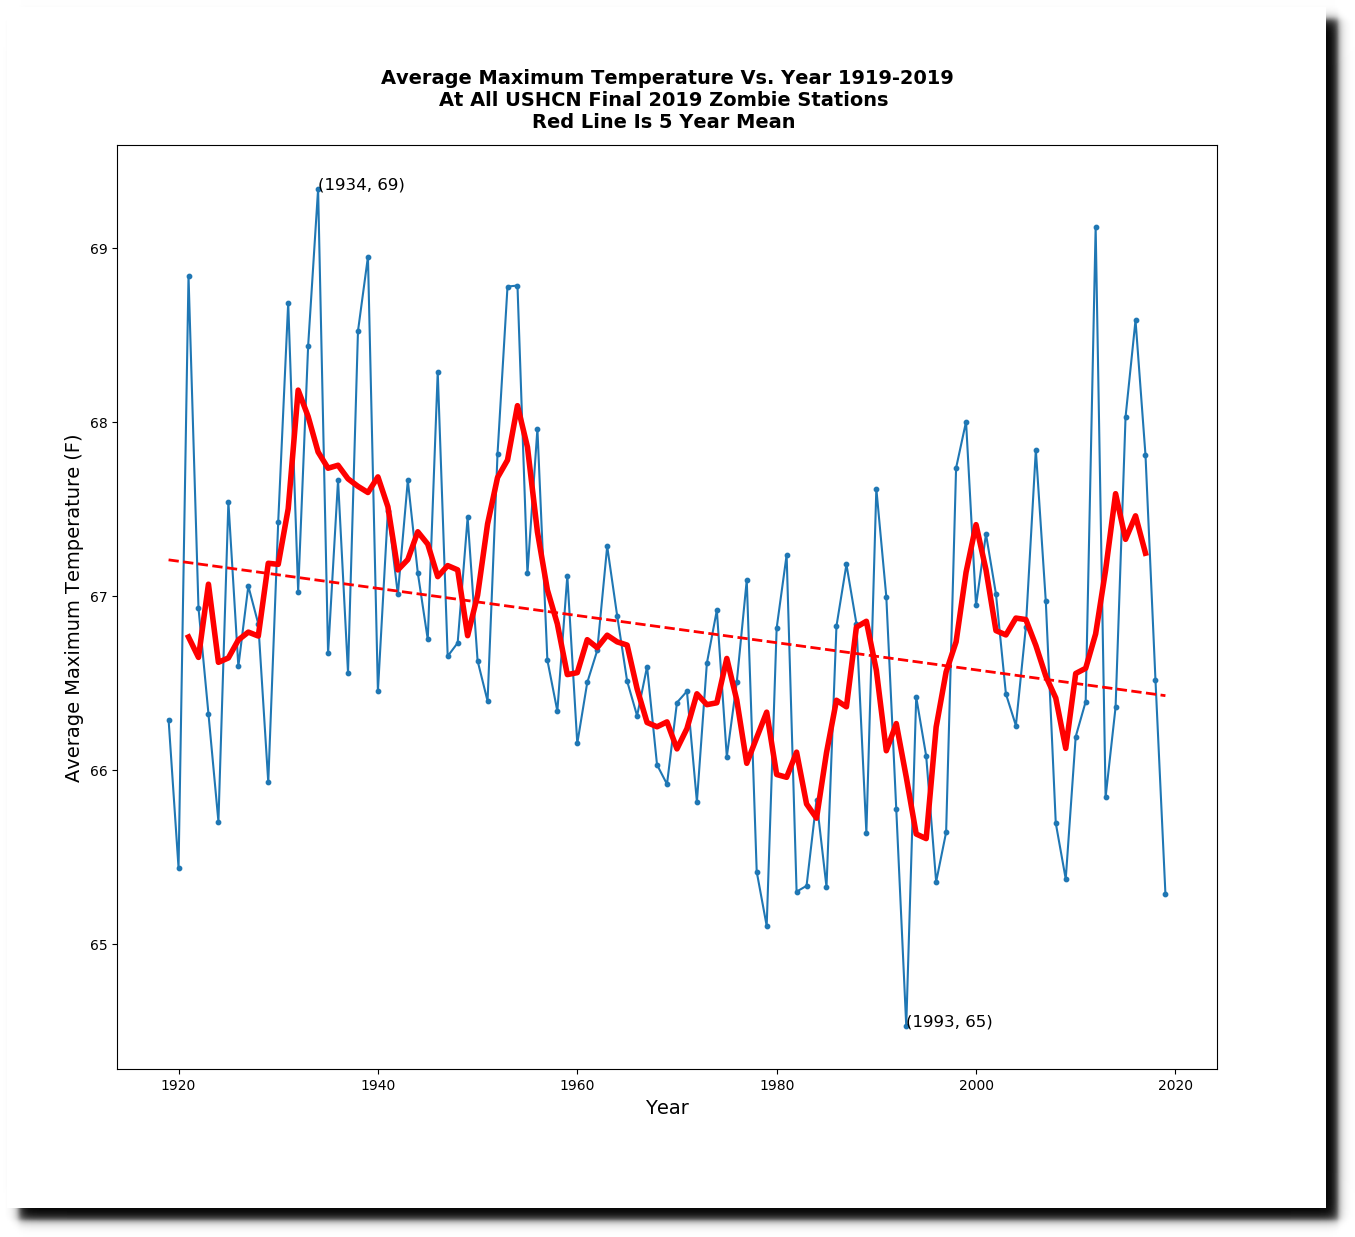
I did an experiment to see how the trends for the 424 zombie thermometers compared with the set of all stations. The trends were very similar. Seventy five of the zombie stations reported some daily temperature data in 2019. The similarity of the two graphs below is a good indicator of the quality of the US temperature record. You don’t need a large amount of thermometers to determine the trend.
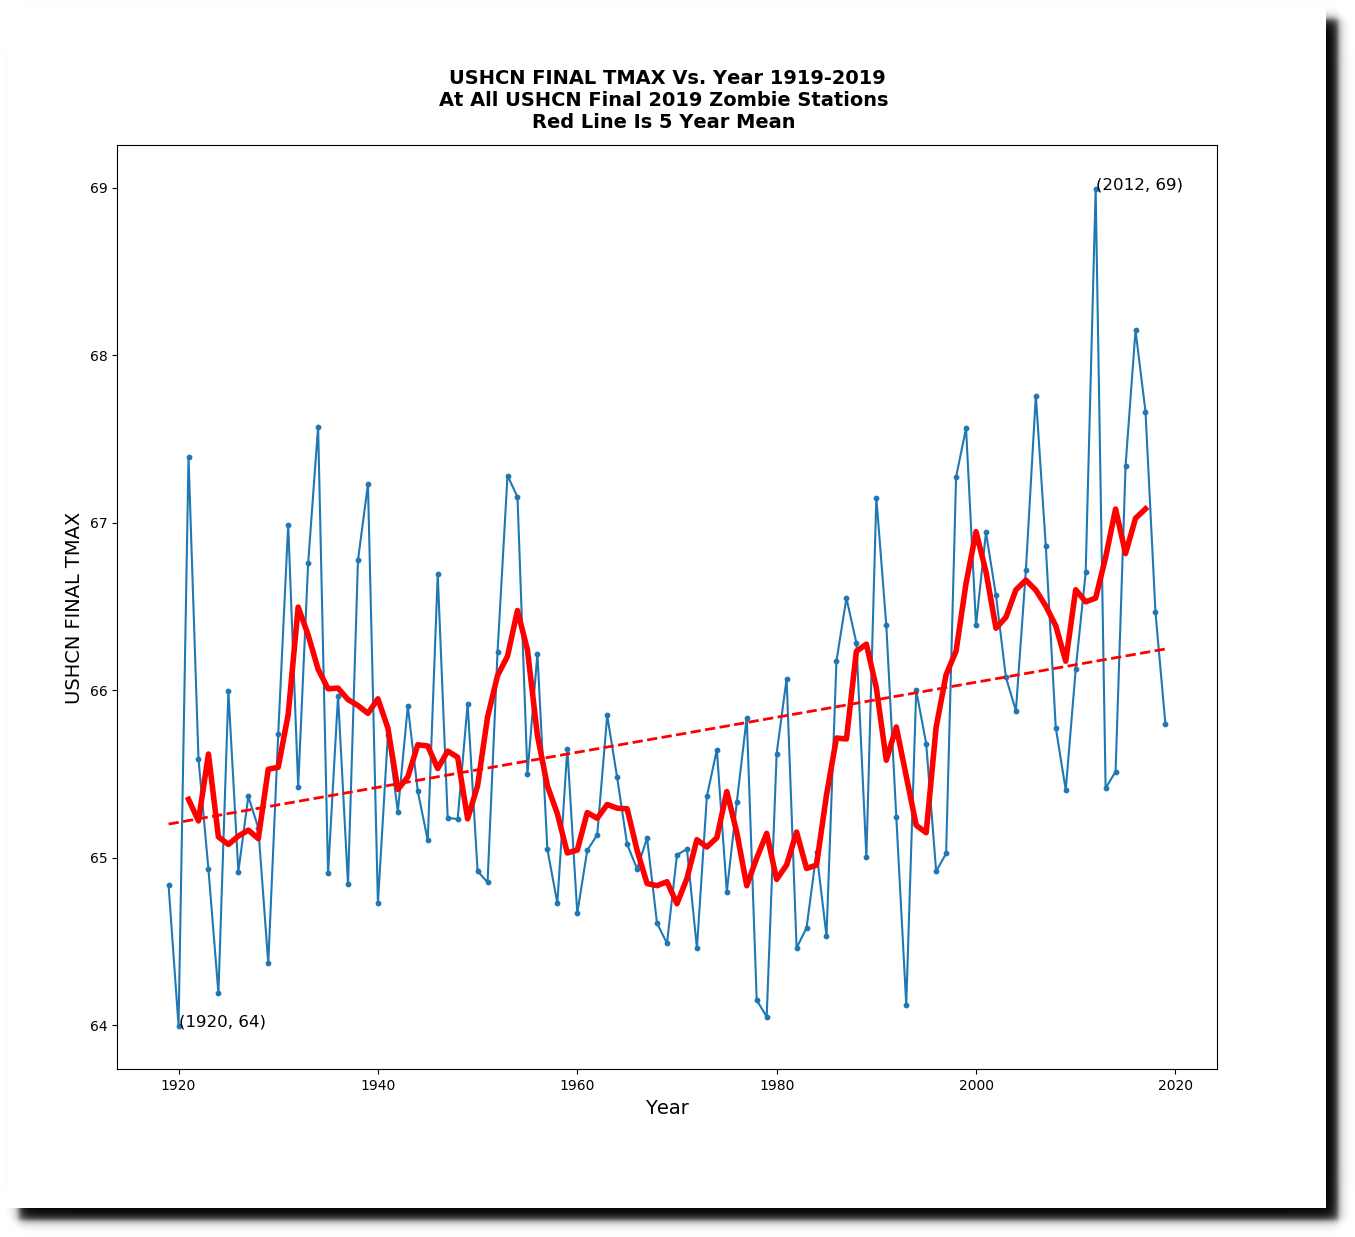
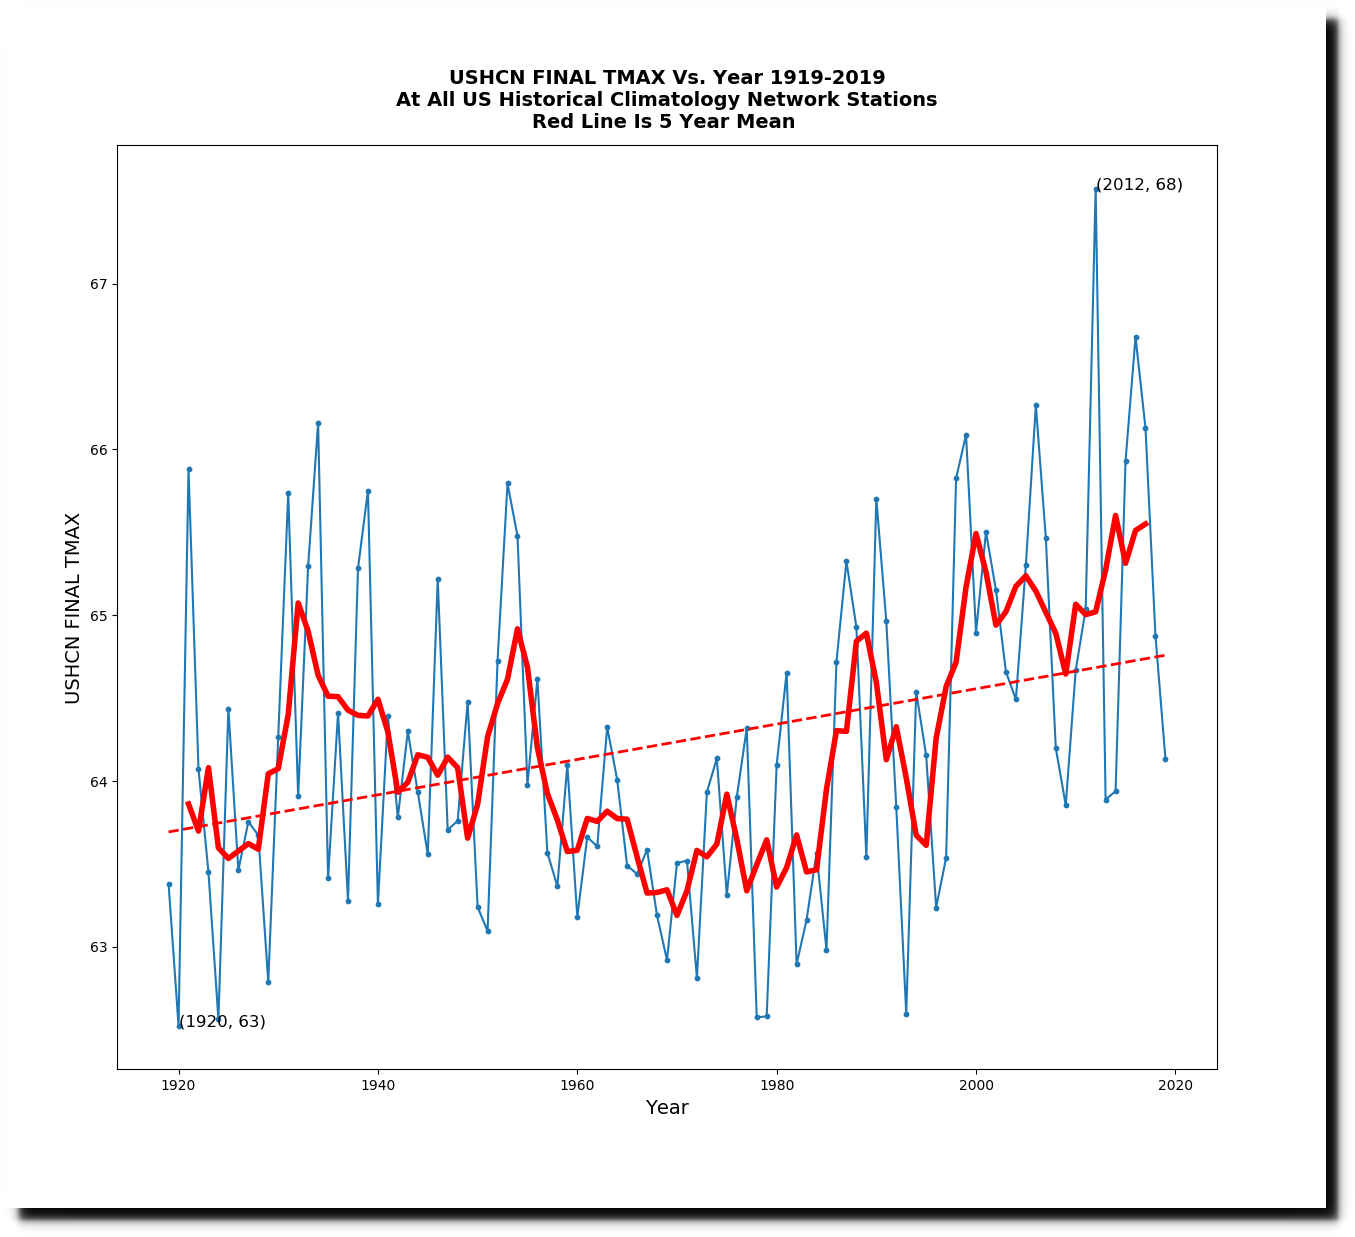
The adjusted trends are also very similar for the set of all stations, and the zombie stations, showing that NOAA doesn’t need any actual thermometer data to create the adjusted data sets – which look nothing like the actual thermometer data.
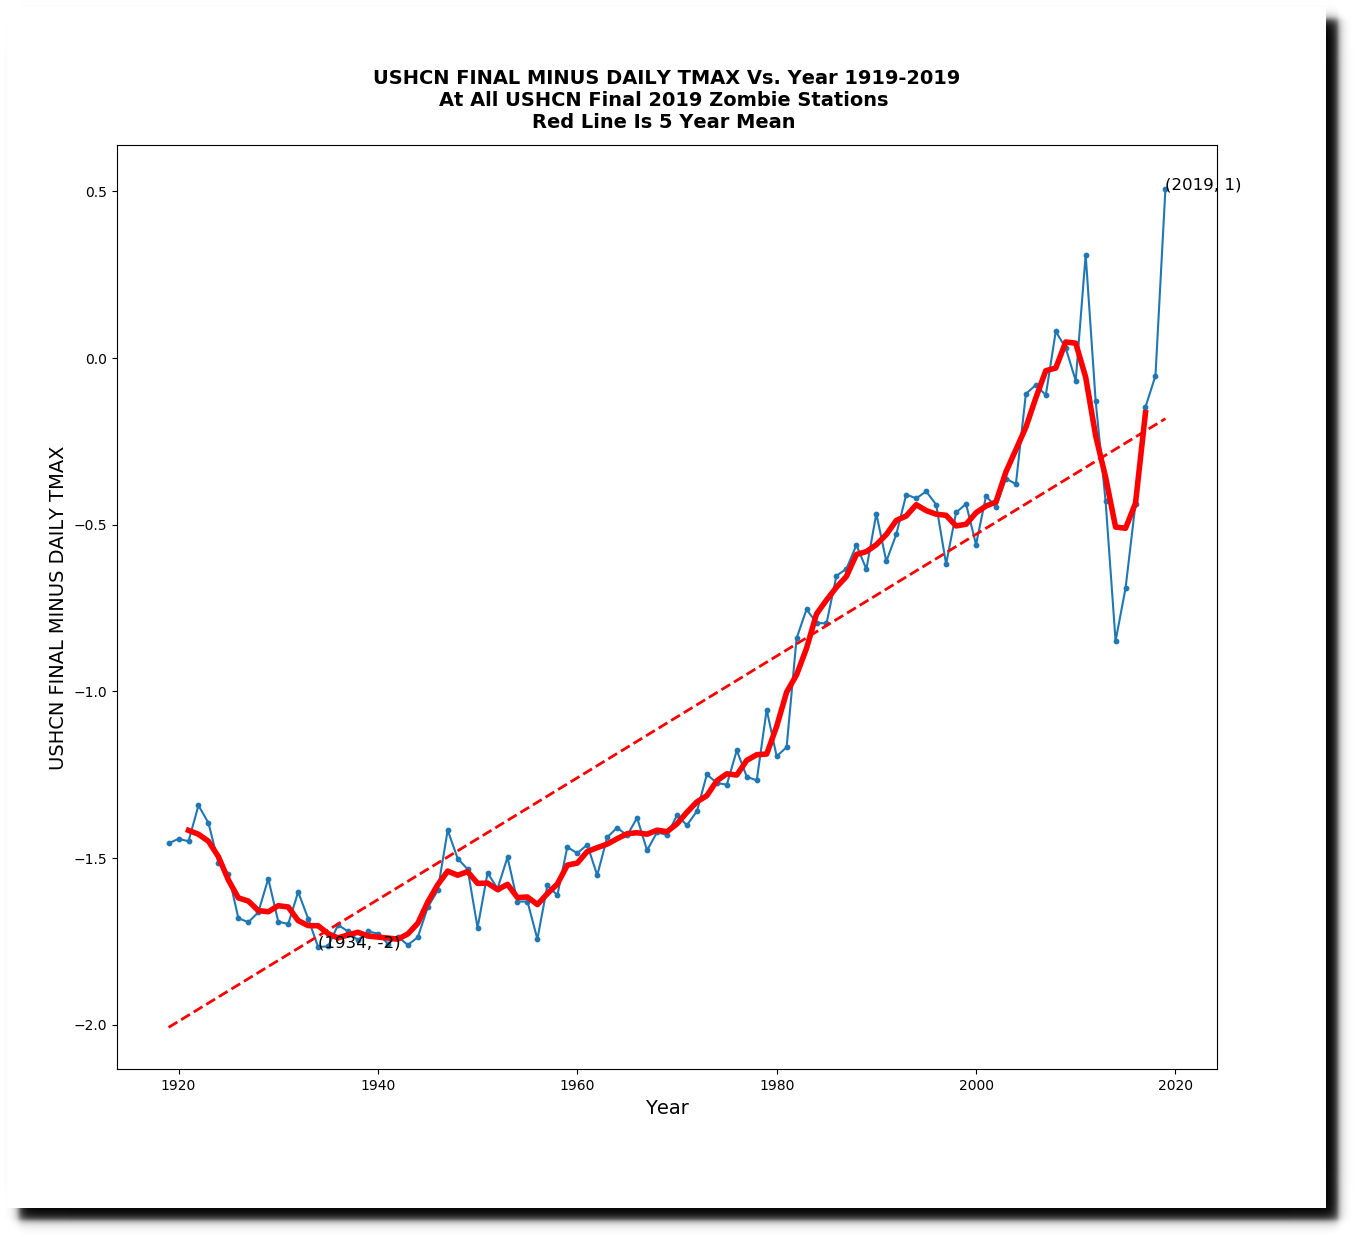
This next graph shows the difference between the adjusted and daily temperatures for the zombie stations, and shows how fake adjusted data is being used to create a huge amount of warming.
Whatever is going on with the final adjustments, it has nothing to do with reality or science.

