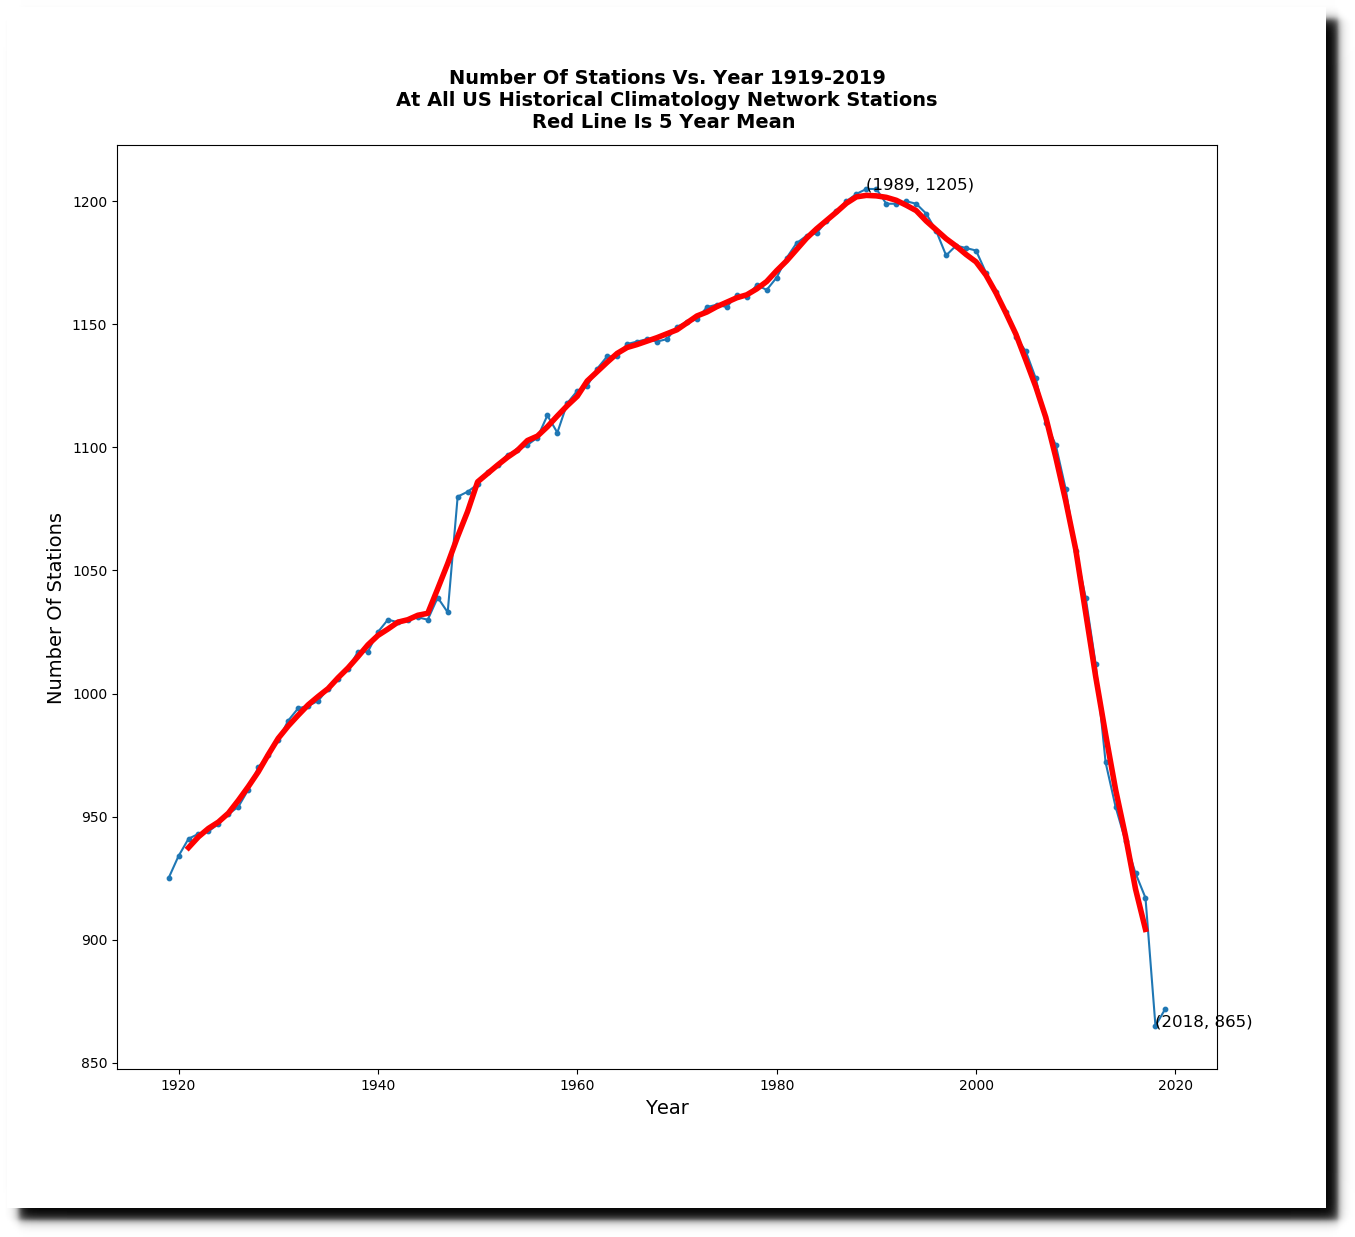
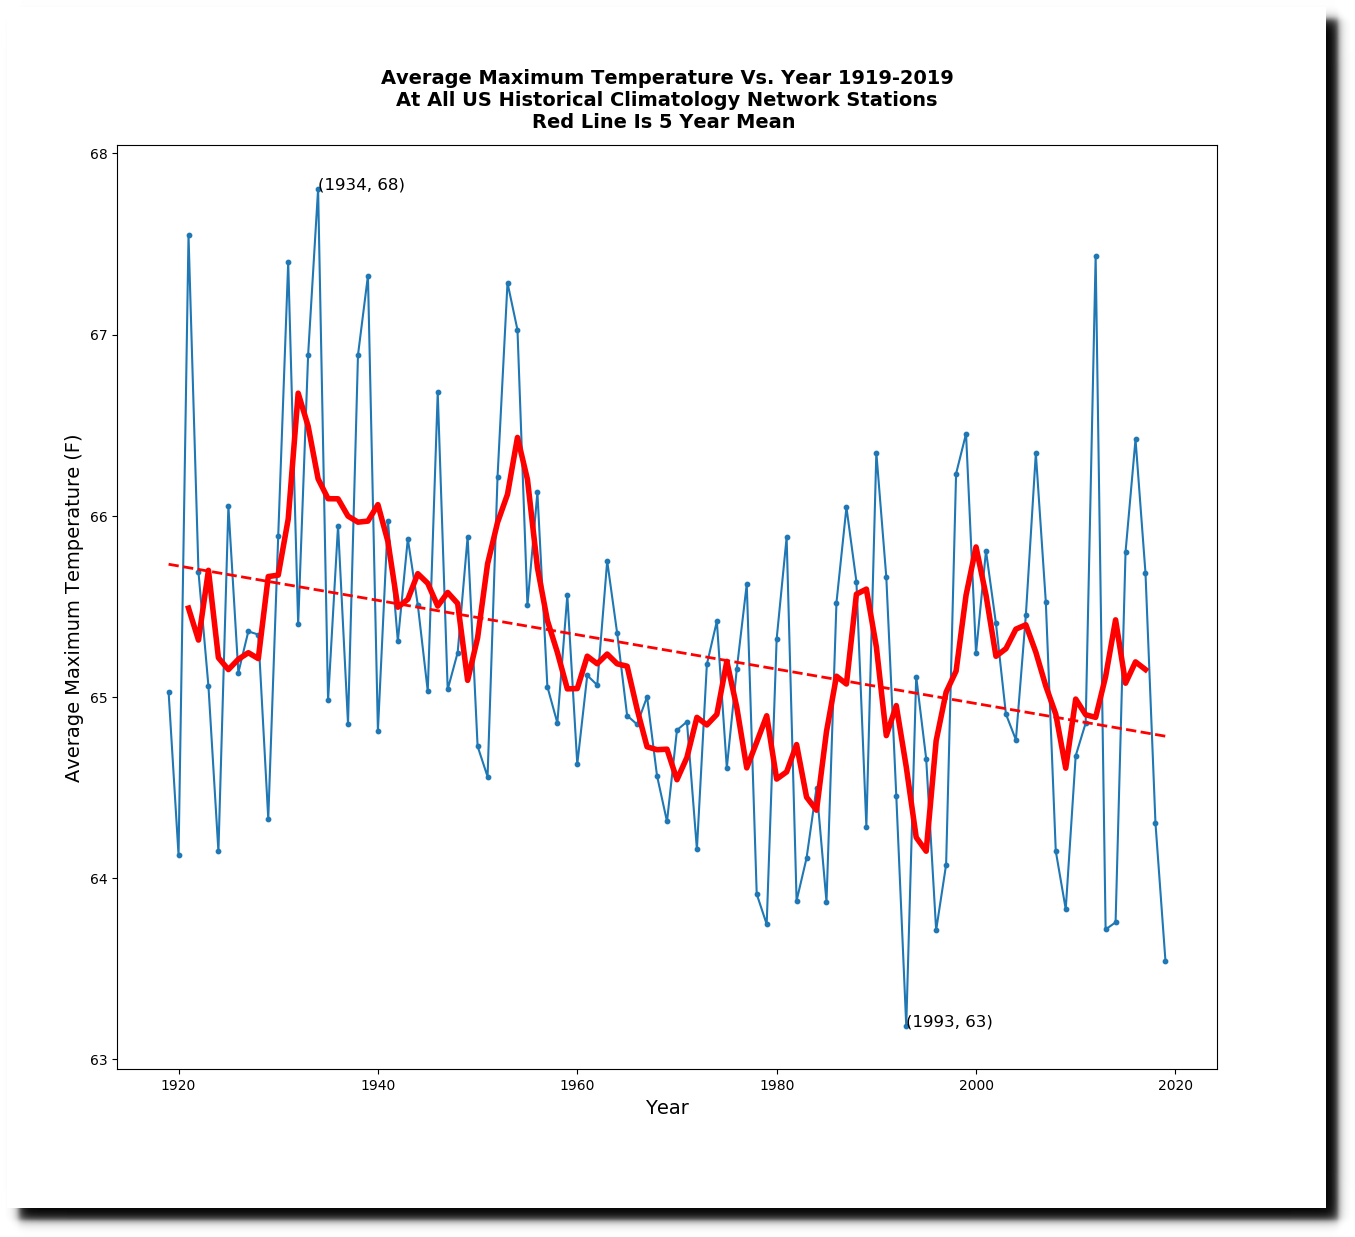
Over the past 30 years, NOAA has been rapidly losing US thermometers. In 1989, 1,205 stations reported some daily temperatures, but last year only 871 stations reported some daily temperatures.
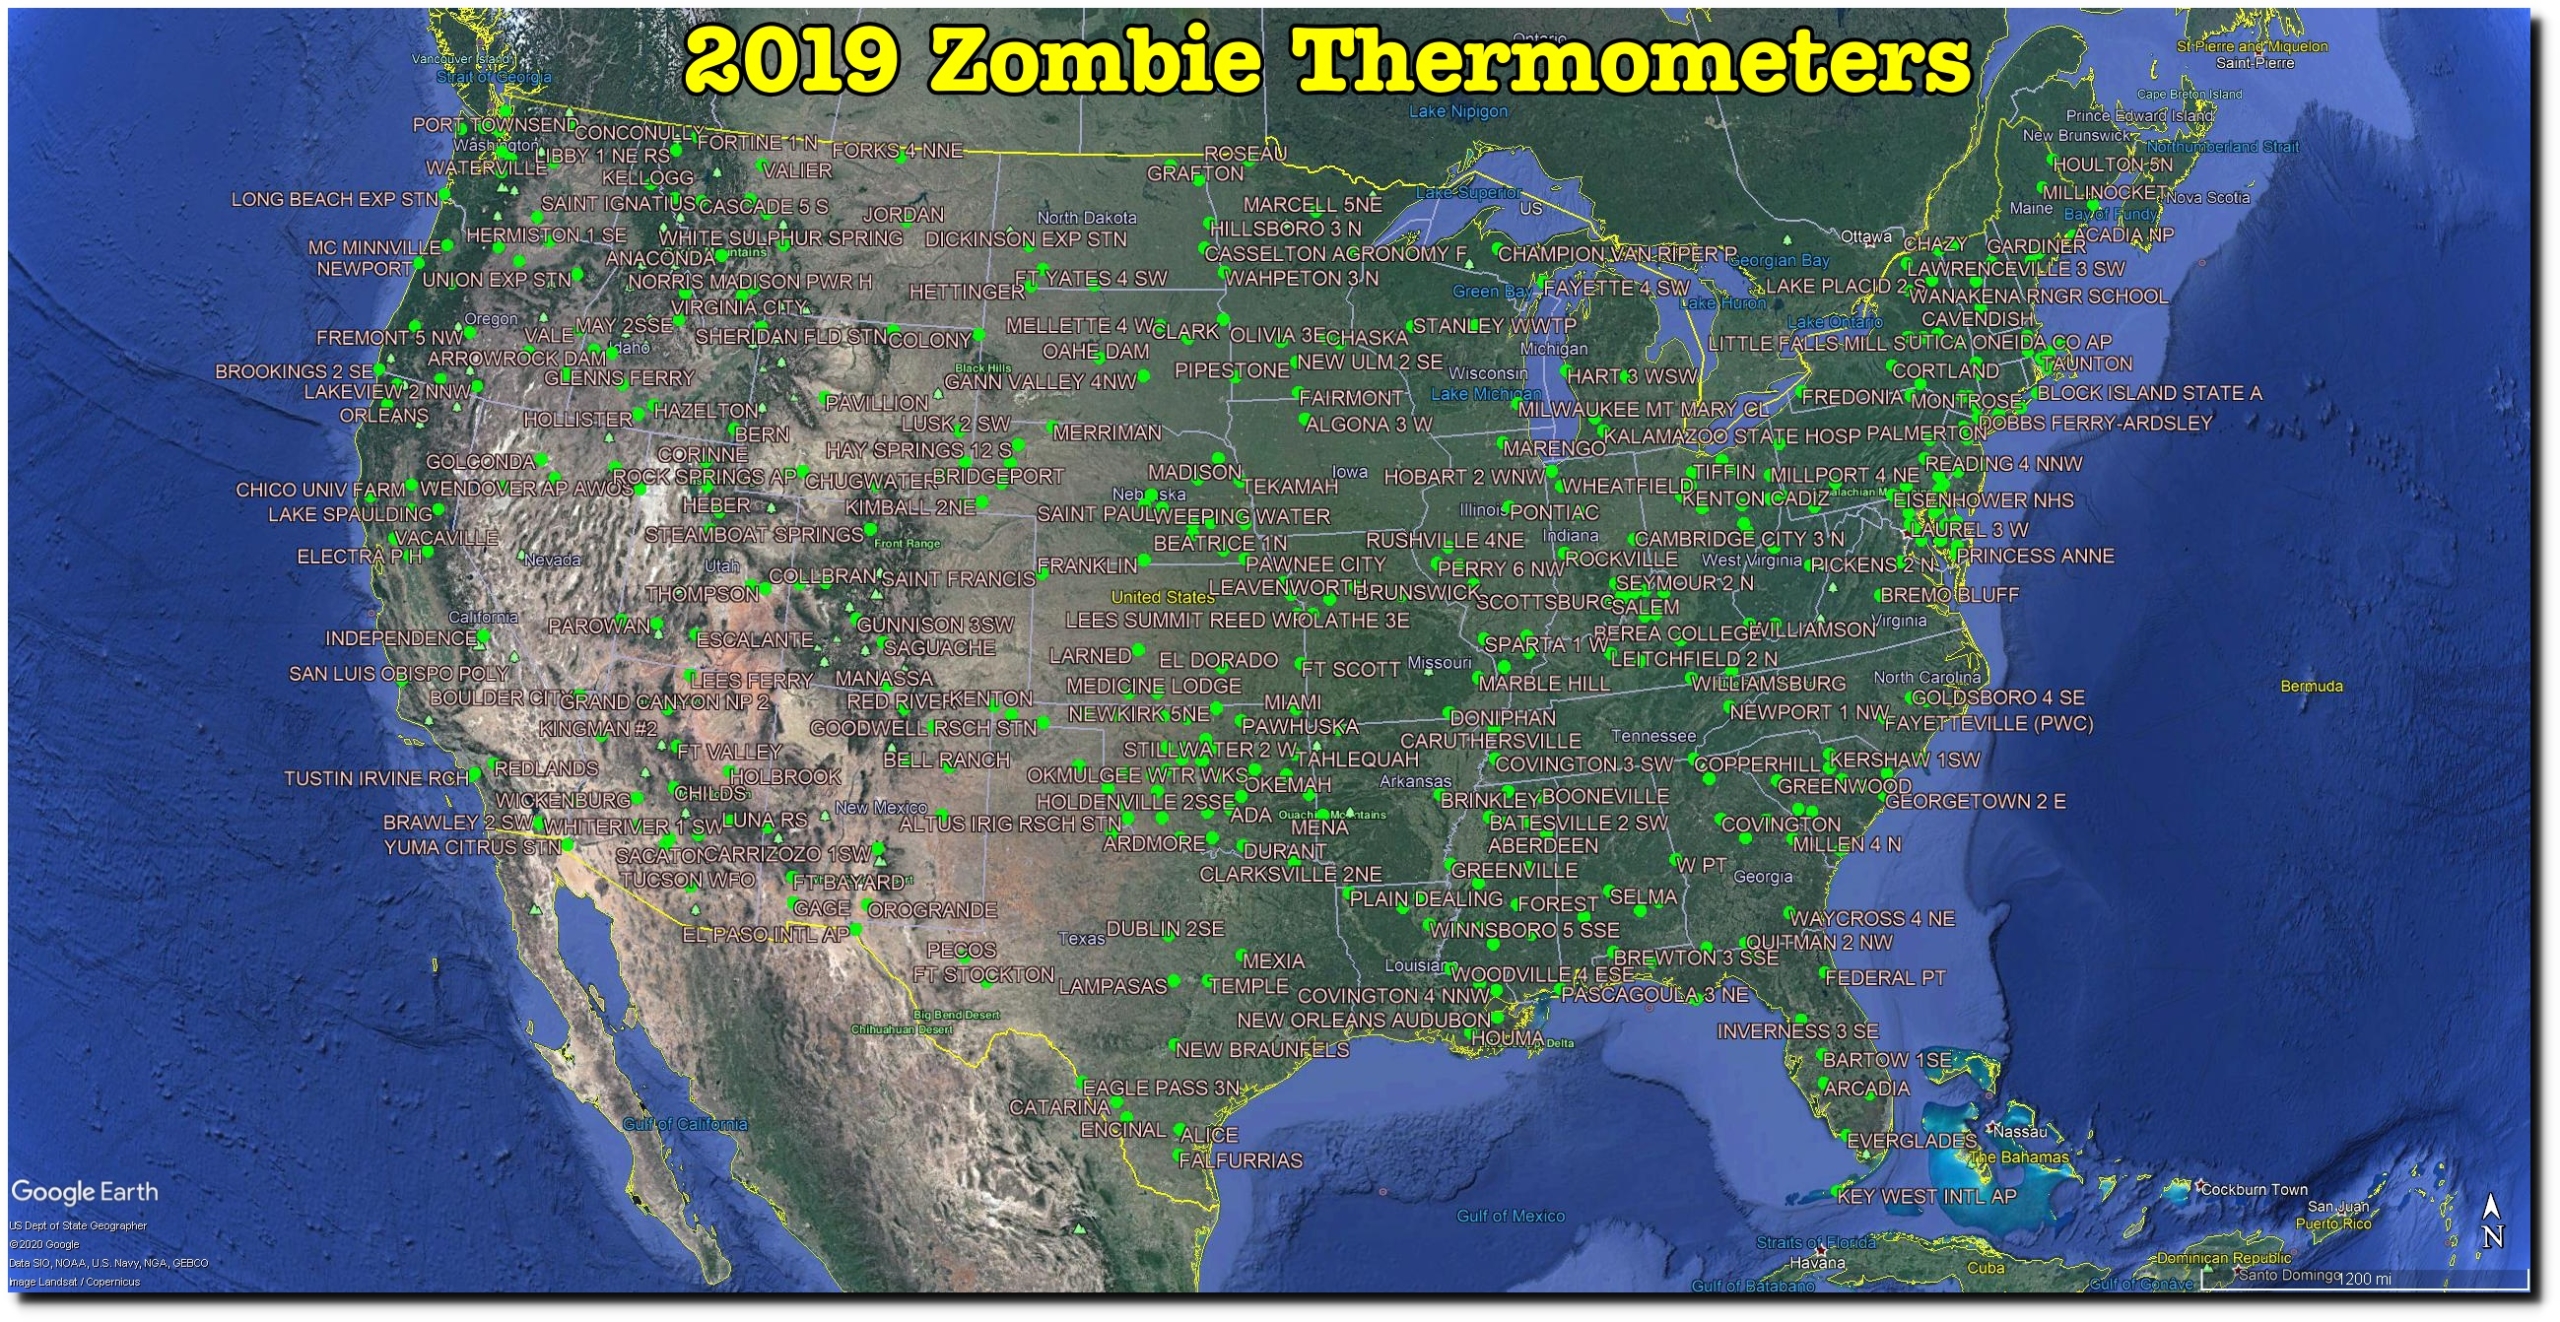
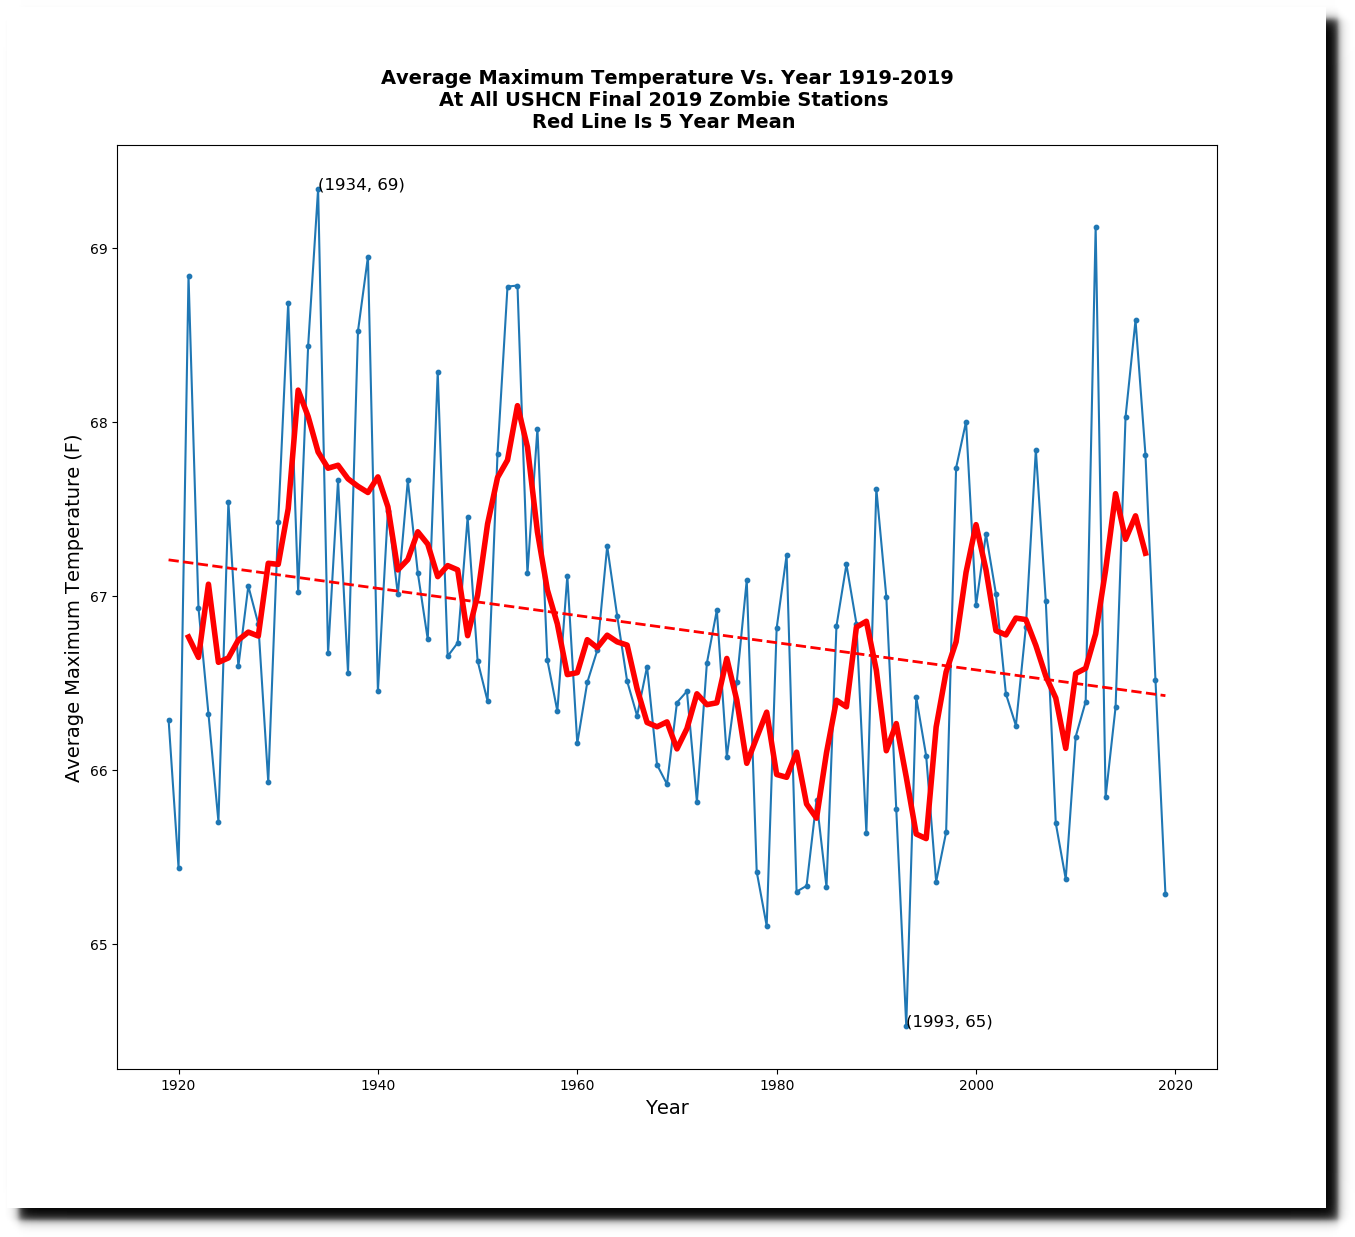
Thirty-five percent (424) of the stations in 2019 were zombie stations, meaning that NOAA estimated data for all twelve months. This is done even for some of the thermometers which reported at least a little data in 2019.
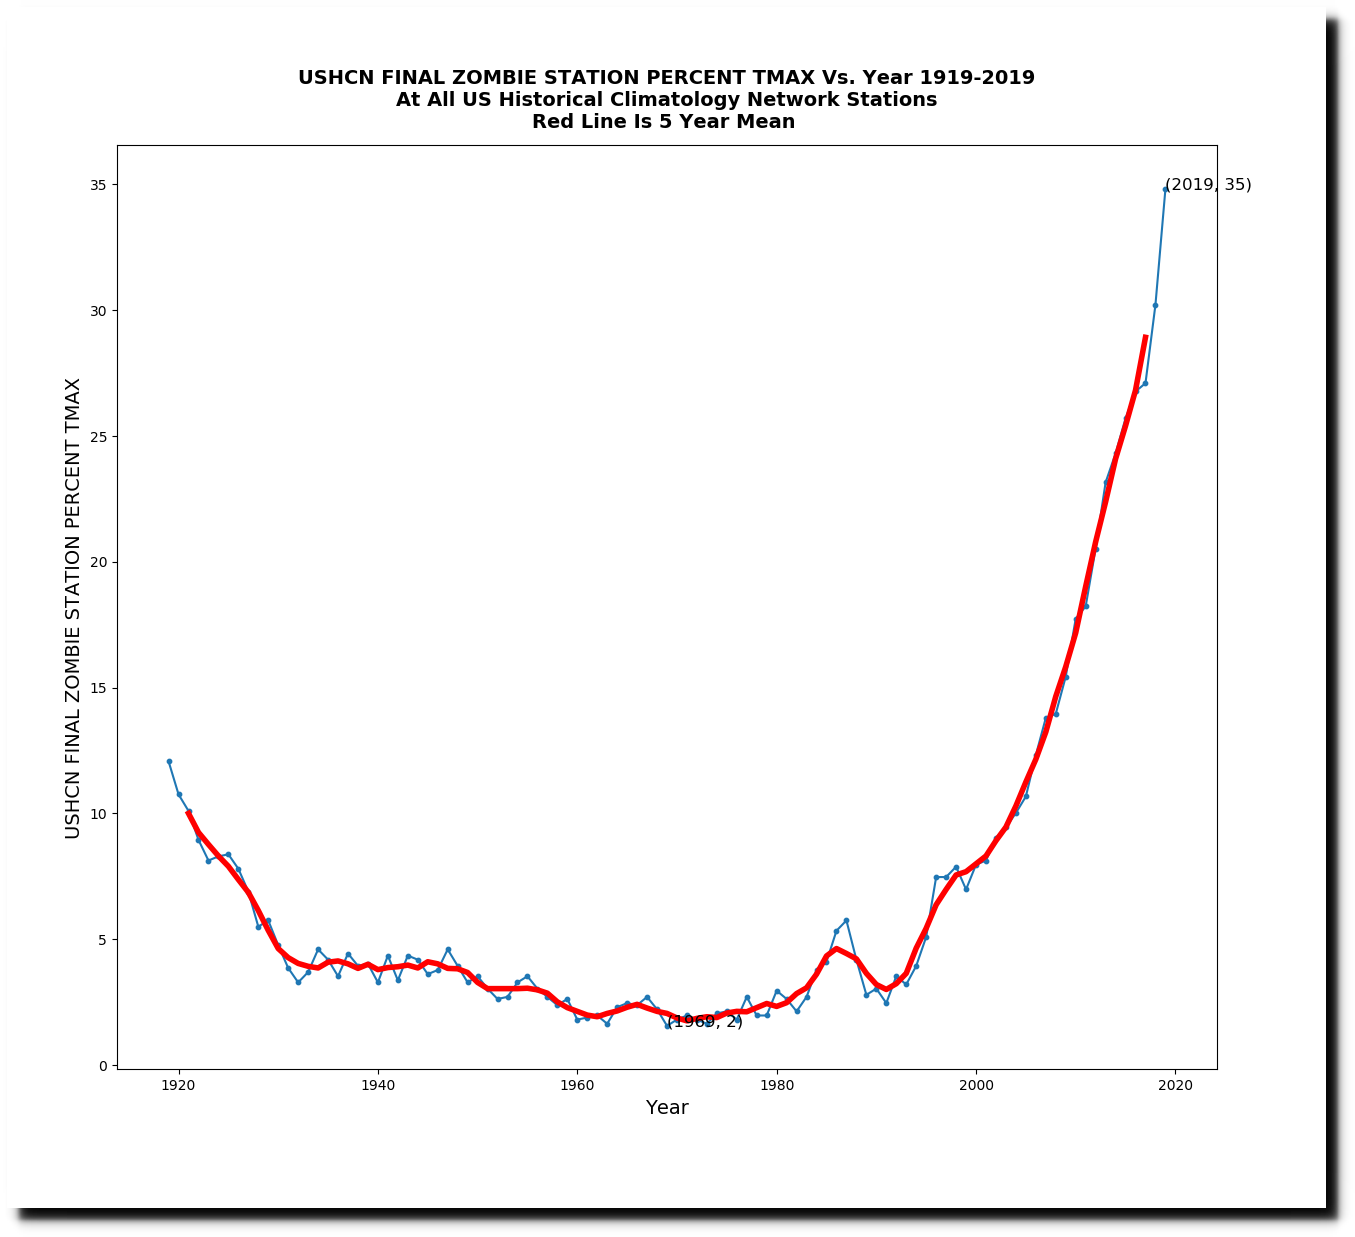
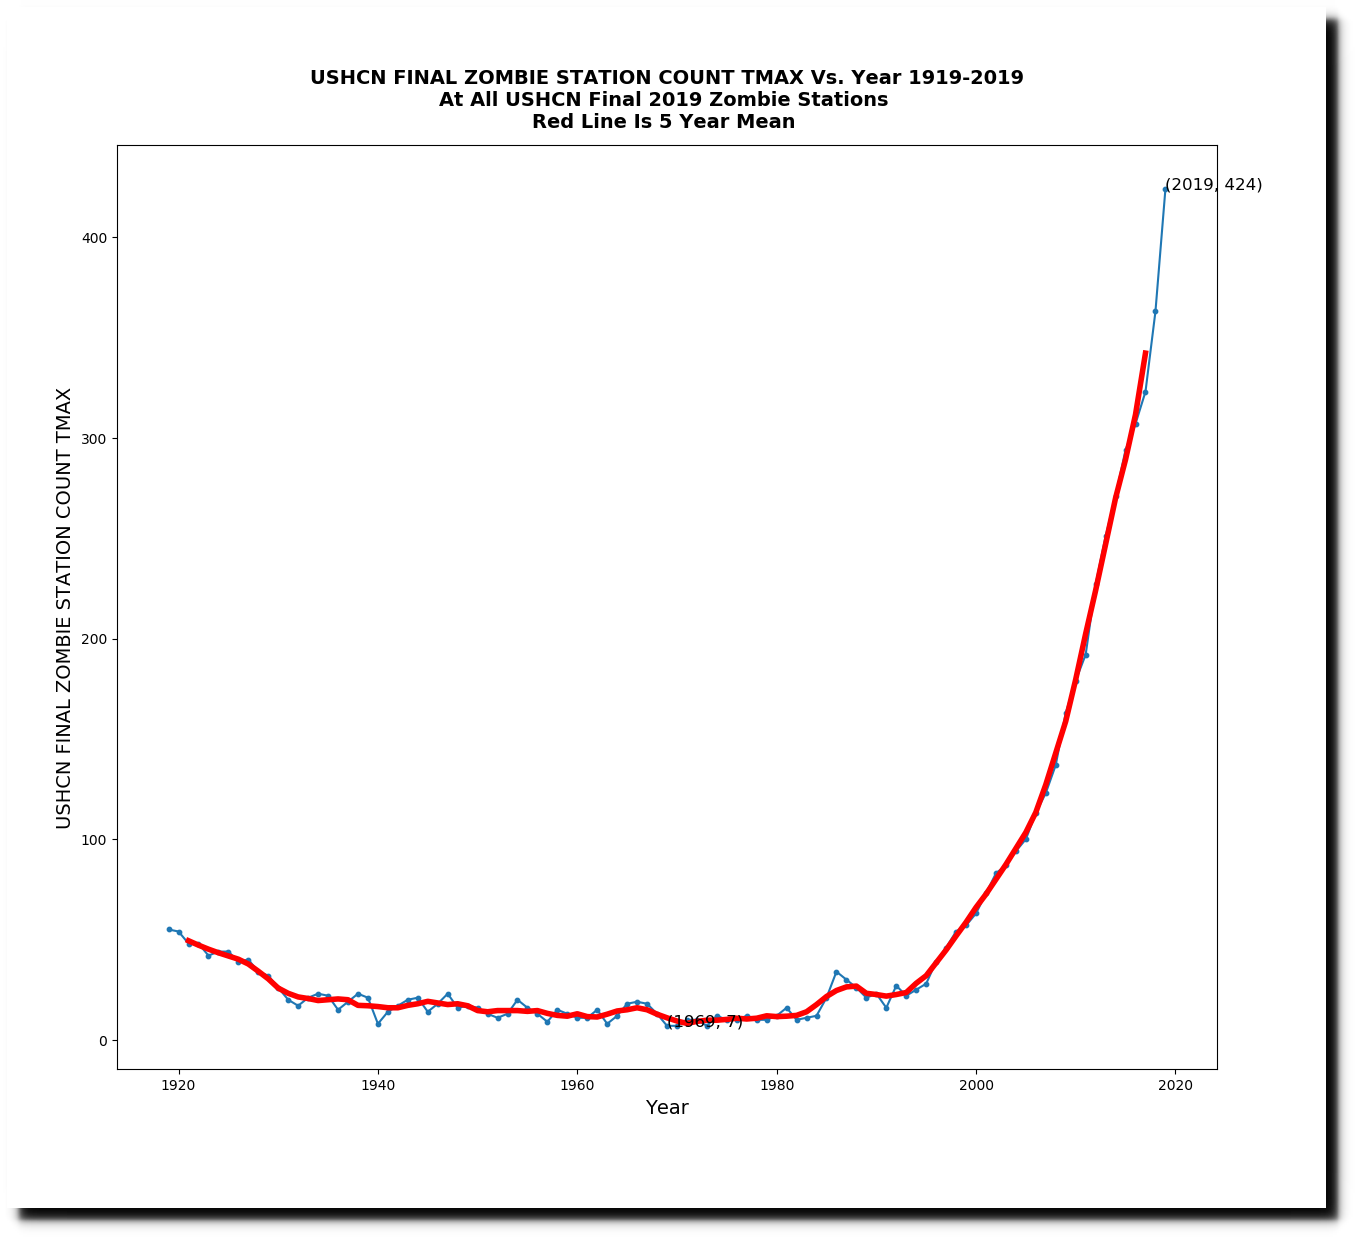
I did an experiment to see how the trends for the 424 zombie thermometers compared with the set of all stations. The trends were very similar. Seventy five of the zombie stations reported some daily temperature data in 2019. The similarity of the two graphs below is a good indicator of the quality of the US temperature record. You don’t need a large amount of thermometers to determine the trend.
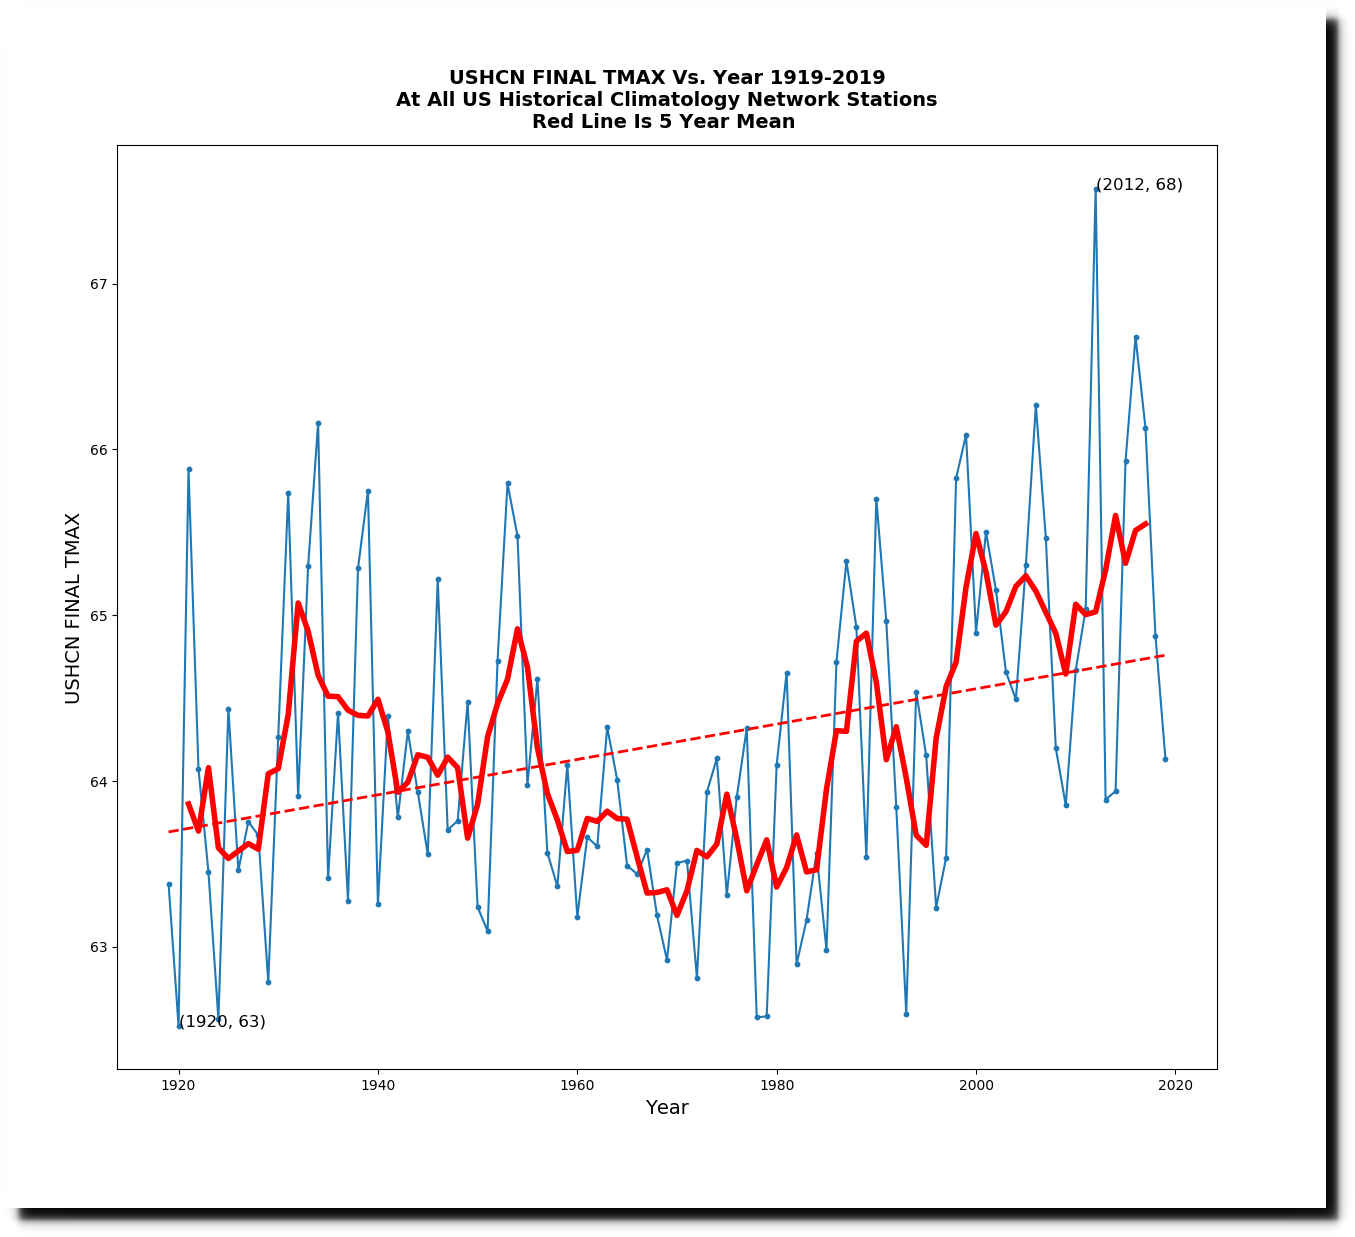
The adjusted trends are also very similar for the set of all stations, and the zombie stations, showing that NOAA doesn’t need any actual thermometer data to create the adjusted data sets – which look nothing like the actual thermometer data.
This next graph shows the difference between the adjusted and daily temperatures for the zombie stations, and shows how fake adjusted data is being used to create a huge amount of warming.
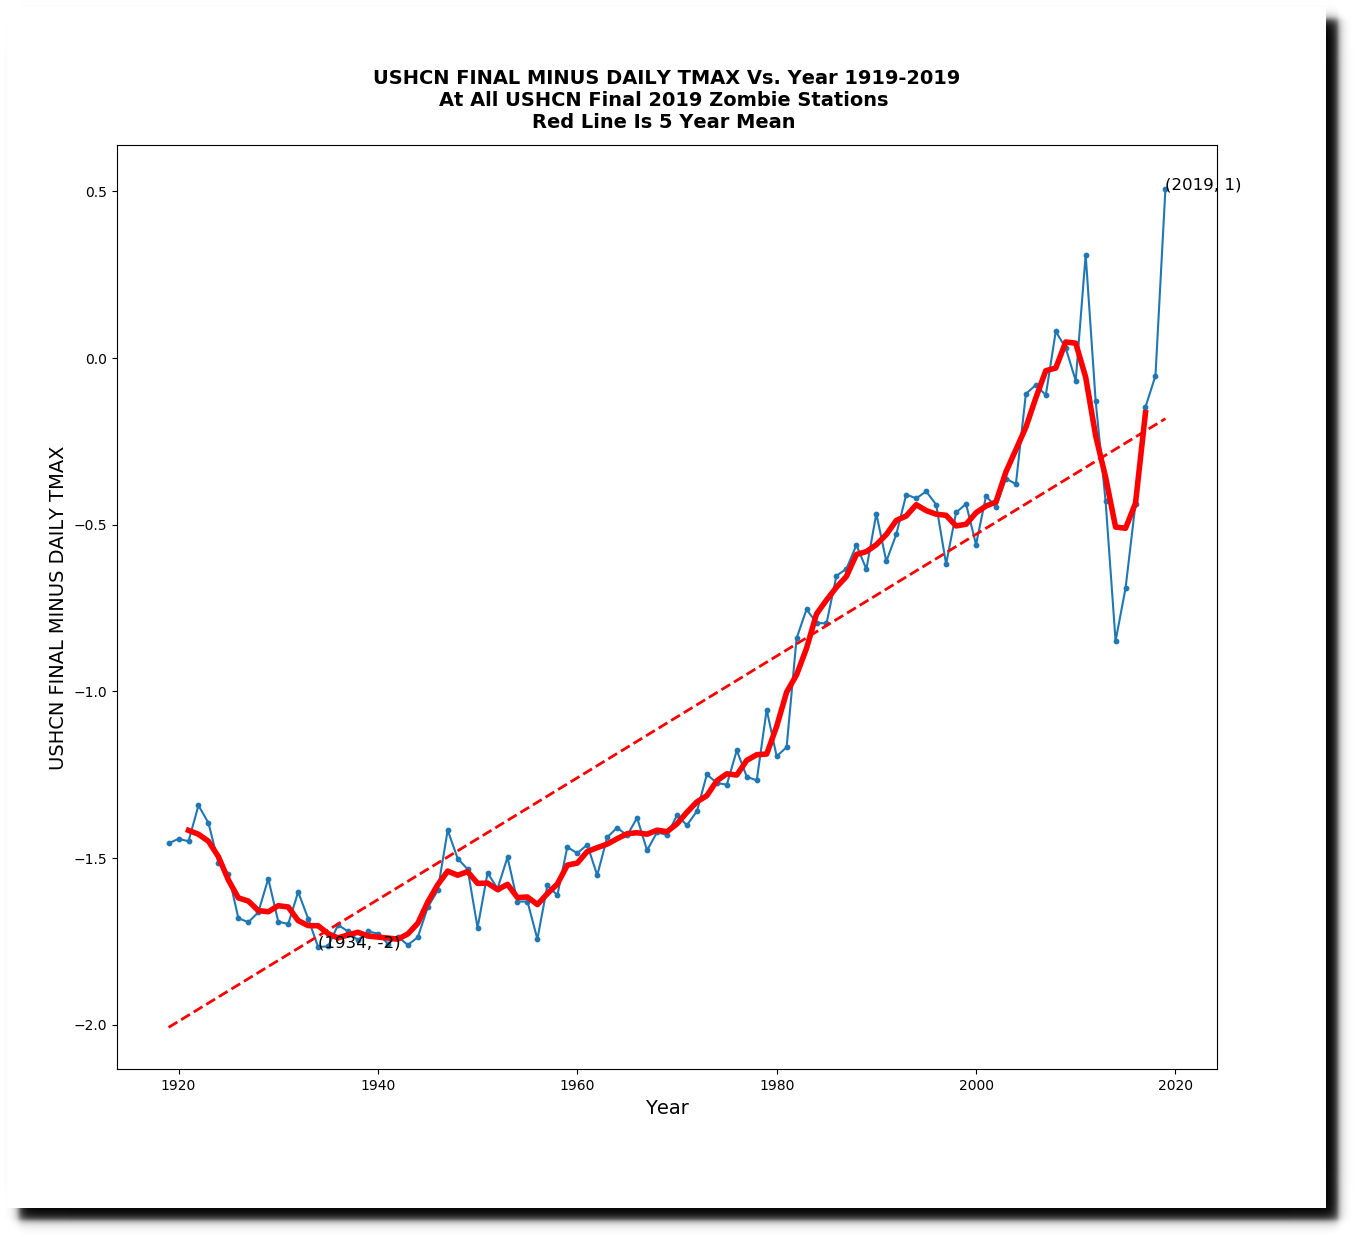
Whatever is going on with the final adjustments, it has nothing to do with reality or science.
Tony
It would be great to ask Mallen Baker for a response here. Since he is so keen for the truth then he should be supporting your exposure of this manufactured data catastrophy, instead of supporting the need to carry out adjustments .
And whilst he is at it he should be calling for a full independent audit of NOAA, NASA and the Australian BOM as their data tampering and adjusting is so obvious. Its just incredible that people just keep essentially saying ‘move on, nothing to see here’. At some stage, like all of these scams, people will wake up and ask why we did not see it….
I have been reading a book called The Green Reich and one of the scientists mentioned is Professor Samuel Furfari. He published a paper – link below- where he used one of Tony’s videos to illustrate how homogenizing temperature data is misleading. Introducing Tom’s video he writes:-
‘However, correcting an urban island effect by homogenizing the data coming from meteo stations located in the vicinity, and which remained away from urbanisation, induces some pervert effect leading to fake conclusions. Indeed, just as the data from the “urbanized” station are tempered by the data from the other stations, the data of those ones are also affected by the data coming from the urbanized station and become somewhat corrupted by the urban island effect. This mutual influence, the perverse effects of it, and the fake conclusions reached, are well illustrated, in a stepwise manner, by the case described in this video :’
It is gratifying to know there are PhD scientists out there who are taking Tony’s work seriously.
http://www.science-climat-energie.be/2019/07/24/climate-about-which-temperature-are-we-talking-about/#comment-2429
As I have repeatedly pointed out to the fraudsters, if you are not removing UHI, then you are employing it. Homogenization employs UHI to arrive at an alarmist destination.
Here’s Climate at a Glance for Los Angeles
December 2017
https://i.postimg.cc/0N1Gy4YM/image.png
February 2020
https://i.postimg.cc/8CdRJb4y/image.png
Wow, the 1945-2000 mean dropped from 73.9F to 71.3F. These climate scientists are like magicians; they can get different results from the same data.
Steve, can you post the NOAA link to these graphs? I have tried to find back to them at NOAA’s homepage without success.
https://www.ncdc.noaa.gov/cag/city/time-series/USW00023174/tmax/6/10/1945-2000?base_prd=true&begbaseyear=1901&endbaseyear=2000
I just tried to replicate your Feb 2020 and got the same 71.3 as in Dec 2017. Maybe there was a glitch or you did it wrong?
What you show us is amazing, Tony, but the leftist NYT, for example, is oblivious to it, or else they are denying it. It’s as if they live in a different universe.
https://www.nytimes.com/2020/03/02/climate/goks-uncertainty-language-interior.html?te=1&nl=morning-briefing&emc=edit_NN_p_20200302§ion=whatElse&campaign_id=9&instance_id=16403&segment_id=21781&user_id=c803f12d58882c1ce47d71480f70eb6a®i_id=60865957ion=whatElse
What is president Trump doing about this?
It demeans science (as in Real Climate Science) to use the word zombie.
The credibility of the site and its postings would be greatly improved by avoiding voodoo.
How about “fake” – does that work? Or “make-believe”? Or maybe “fiction-derived”? “Model-generated” implies that the model has some skill and can make predictions. The fact that the model temperatures and measured temperatures differ so much should indicate the models do not have skill.
Effective communication does not demean “science”- I know, cause I asked her.
I’m sure our host welcomes your free advice on how to improve the site.
As for voodoo, I don’t think you should demean it by comparing it with the “science” of AGW.
I suspect that they infill the missing station data using a climate model.
How could they not resist doing that?
The problem of course is the climate models all have vastly too high CO2 sensitivity entered into them (except the Russian one), so any site specific estimate they produce is going to be too hot. Then the estimate skews the overall data upwards to “match” the supposed real temperature with the model output in a snake-eating-its-tail circular argument.
I have no evidence to show this is going on, but when you have a nice shiny supercomputer model you will be awfully temped to use it, especially if you believe the climate fraud already.
(Snow extent data shows how wrong the terrestrial temperature record now is. You can’t fake snow, it melts above 0 C come what may and is easy to measure from orbit by pixel count. It hasn’t changed on average for a quarter century.)
Here’s another good write up demolishing the climate narrative:
https://www.americanthinker.com/articles/2020/03/how_to_measure_the_temperature_of_the_earth.html
“They start with the conclusion and search for the evidence.”
This alone disqualifies climate so-called scientists.
Can you please provide a specific link or something to show how you found which stations are “zombie” stations? Thank you.
In the late 1980s I read a lengthy article (NYT, I think) on Global Warming. It had a fair amount of data and charts, among which was year-by-year count of the reporting stations. Out of curiosity, I graphed the rising count of the stations against the reported temperature increases. The correlation was 98%.
The conclusion was obvious: the increasing number of reporting stations was driving up the global temperatures. If we wanted to reverse the global temperature rise, we would need to close down reporting stations. I wrote this up as a facetious paper, and send it around to some acquaintances.
It appears the powers-that-be took my advice, and started to shut down some stations, apparently in an attempt to reduce the global temerature.
Alas, I had not anticipated the rearguard action by the folks committed to preserving the global warming hysteria: I never expected that they would continue receiving data from those stations, even if they had to create the data….well….out of thin air. How else were they going to keep the increasing global temperatures thing going if they didn’t have the requisite number of stations to produce it? They needed those stations to exist, whether the stations were real or not.
I’m glad that their nefarious plot has finally been revealed.
Tony,
TY for comparing zombie station temps with still operating station temps.
Is the following understanding correct? Zombie station temp estimates are corrupted by adjustments made to ongoing station temps. Presumably, zombie temps are interpolated or extrapolated using data from surrounding stations still collecting data.
Glad to learn you have secured additional funding and will devote more time to revealing & explaining climate realities.
Tony,
I have an idea to combat the zombie temperature station issue. If the actual temperature stations are no longer reporting data, so NOAA is taking this opportunity to insert their manufactured temp data, why not crowd-source the temp data from people with home weather stations (like I, and thousands of other have)? My weather station stores and can transmit it’s stored temp data. Why not set up a website or some kind of database where average citizens can automatically upload their location/temp data, then perform an appropriate statistical analysis to the larger dataset to extract the daily hi/lo temp data. One could then use that information to debunk the fake data from NOAA for these zombie stations AND you could also confirm the temperature information for the working temperature stations.
Crowd sourcing is a very powerful tool that could be used to combat “fake data.”
Hi Tony,
The objection to your conclusion might be that the silent (modeled) stations are not random, thus throwing that data away is inappropriate.
A straightforward experiment to disentangle modeled component:
Compare how silent station modeled data correlates with closest (by distance) measured temp stations NOAA adjusted (and raw, separately) data over 1) period before the station went silent 2) period while silent.
You can also cluster total station data, sorted by silence date, to see whether silent stations cluster together before silence. This will tell you if they are special, or were normal before silencing, and became special after.
Best.
And thank you for your enlightening work!