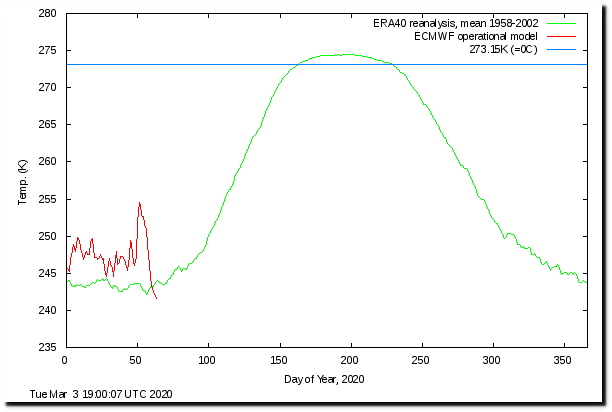
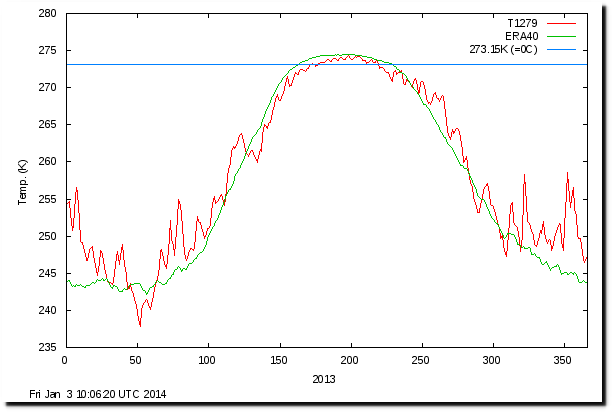
Temperatures near the North Pole have dropped below -30C. The last time it was this cold was late February 2014
Email Subscribe
Disrupting the Borg is expensive and time consuming!
-
Recent Posts
Recent Comments
- Peter Carroll on Ten Years Left
- Michael Spencer on Ten Years Left
- gregole on Cited On Sky News Australia
- gregole on Solar Energy To Power Canada During Winter
- Lance on Solar Energy To Power Canada During Winter
Archives
- April 2021
- March 2021
- February 2021
- January 2021
- December 2020
- November 2020
- October 2020
- September 2020
- August 2020
- July 2020
- June 2020
- May 2020
- April 2020
- March 2020
- February 2020
- January 2020
- December 2019
- November 2019
- October 2019
- September 2019
- August 2019
- July 2019
- June 2019
- May 2019
- April 2019
- March 2019
- February 2019
- January 2019
- December 2018
- November 2018
- October 2018
- September 2018
- August 2018
- July 2018
- June 2018
- May 2018
- April 2018
- March 2018
- February 2018
- January 2018
- December 2017
- November 2017
- October 2017
- September 2017
- August 2017
- July 2017
- June 2017
- May 2017
- April 2017
- March 2017
- February 2017
- January 2017
- December 2016
- November 2016
- October 2016
- September 2016
- August 2016
- July 2016
- June 2016
- May 2016
- April 2016
- March 2016
- February 2016
- January 2016
- December 2015
- November 2015
- October 2015
- September 2015
- August 2015
- July 2015
- June 2015
- May 2015
- March 2015
- January 2015
Maybe the colder than normal polar regions is why this graph indicates record snow mass for northern hemisphere?
https://globalcryospherewatch.org/state_of_cryo/snow/fmi_swe_tracker.jpg
I think the ice in the Central Arctic must be thicker this year. Not only was it colder than recent years earlier in the winter, before this current cold snap, but the sea-ice has been constantly pulled from the Siberian coast and exported north by offshore winds, which piles the sea-ice up in the Central Arctic.
Usually I have to wait for the yearly Barneo event in late March to get any first-hand information from the surface of the sea-ice, but this winter the MOSAiC expedition has been drifting across the Pole. An indication that the Central Arctic ice may be thicker might be seen in the fact that the Russian beast-icebreaker Kapitan Dranitsyn took around two weeks longer than expected to resupply the MOSAiC expedition’s ship, Polarstern.
https://sunriseswansong.wordpress.com/2020/03/03/arctic-sea-ice-a-wrap-around/
https://earth.nullschool.net/#current/wind/surface/level/overlay=temp/orthographic=-307.64,90.07,305/loc=-140.534,89.159
The temperature of the North Pole is still minus 36 Celsius.
“Climate change is a global emergency. The Amazon rainforest is burning, Greenland’s ice shelf is melting, and the Arctic is on fire”. says Bernie Sanders.
https://berniesanders.com/issues/green-new-deal/
Jeeh, they don’t call him Crazy Bernie for nothing. Last summer there were some forest fires in Siberia and the MSM made a big deal out of that (although for centuries these fires happen every summer). Record cold temperatures are the clear proof that the Arctic is not on fire at all, but Bernie doesn’t care about the truth.
I’ve noticed that the days are getting longer and temperatures are going up, at this rate……,as a climate refugee in Phoenix, I might have to move back to Canada
Actually, the sky is falling. I was walking under a tree this winter and a white piece of cloud hit my head. The sun is now closer causing global warming.
The Chart looks to be for 2013. Plotted in 2014.
You are correct. Tony made a tiny error or typo in identifying the year of the second chart.
Claiming that a cherry picked anomalous few days indicates anything at all is the real problem, however. It would be much more instructive to note that the average winter arctic temps in recent decades is considerably above the long term winter averages.
Define “long term winter averages”. I’ll wager that we do not agree, and that my long term averages would be much, much, much, much, much, much, much, much, much more meaningful than your fake “long term”.
Leftists are defined by their psychological projections.
Please look at the chart. “The green curve is based on ERA40 data for the period 1958 to 2002.”
I am neither left or right, and I don’t devalue someone’s beliefs by any political measure. I happen to be open to all ideas. Try it sometime. You might be surprised.
Gary, are you as dumb as you pretend? Try reading my comment again, and answering the question.
Define “long term winter averages”.
Your lefty slip is showing. Only lefties support climate alarmism. Lying is not attractive Gary, but it is expected from you.
It’s nice that you claim to be open to all ideas, while you support alarmism. It’s also nice that you value your opinion over those of us who actually spent time and money at a major university studying climate change.
Only an alarmist idiot would call 1958-2002 a “long term winter average”.
Shh. Don’t wake the children. Your mind slamming shut is reverberating throughout the house. Seriously, you might consider attempting to get a tuition refund.
Seriously, you might consider attempting to get a tuition refund.
LOL
So Gary, when I am able to discern that a few decades of climate data is not long term, and you are not able to see the clearly obvious, then I need a tuition refund? LOL
You’re funny!
My mind can comprehend the difference between 40 years and 4,000,000,000 years.
You lefties make the greatest projectionists!
But not lower than the 1930s,40s
https://i.postimg.cc/nhHDvyVG/arctic-temp.png
Thank you for that link. I appreciate all relevant information.
It takes years, even lifetimes, before children understand the cyclic nature of the universe.
2020 Coldest North Pole Temperatures In Six Years, I googled the above to see what info would pop up, a WHOLE page full of record setting warm temps all over. I cant FIND any google evidence on the charts that show record COLD. I believe you and have always felt Global alarmist are making money and cant change their story, but they are writing history currently, How do we get this to STOP? Why cant your info be seen on google or youtube? Are you banned? I want to show people evidence but when people goggle, they call e a conspiracy
…but when people goggle…
That was their 2nd mistake.
Their first mistake was watching and reading the MSM.
Their third mistake is believing that that search engine and the MSM are not continually manipulating them.
Goebbels is dancing in his grave. Yes, they censor. It’s not a theory. They are doing it. They are reporting what they want the public to see. You’re not a conspiracy theorist.
Hi Tony,
Food for thought, more lies from that IPCC
⚠️CAUTION⚠️CAUTION⚠️CAUTION⚠️TRUTH INSIDE⚠️
The IPCC’s latest update on it’s website is showing a watered down version of the 1990 report, and an incorporated supplementary 1992 report.
The original shows a graph where it states the mean global temperature to be 15 deg C.
Fast forward to AR 4 in 2007 and there is graph in there with 15 deg C nowhere in sight, a mean global temperature of 14 deg C is now in situ.??
No wonder the temperatures look like they’re rising ?♂️
1. In 1990 the IPCC released it’s first report on climate change and it a reference to 15 deg C global mean temperature: Note page xxxvii of IPCC report 1990 and the “observed surface temperature” is 15 deg C, page 45 of 414.
https://www.ipcc.ch/site/assets/uploads/2018/03/ipcc_far_wg_I_full_report.pdf
Google drive PDF: https://drive.google.com/file/d/1z0LT3SfhOkyCtIxoywVWvWlC4fid72Ob/view?usp=sharing
(See picture 1 of table, cross check individually for confirmation via above links, all pictures available on the following google drive link: https://drive.google.com/drive/folders/1yKsRqEzMGBW3v7252mOB1p6m7Gdyp-gt?usp=sharing )
2.In the IPCC report AR4 released in 2007, the graph shows a mean global temperature of 14 deg C, note page 6 graph with the absence of the old 15 deg C measurement
(See picture 2 of graph showing 14 to 14.5 deg C as the new reference range)
https://www.ipcc.ch/site/assets/uploads/2018/05/ar4_wg1_full_report-1.pdf.
Google drive PDF: https://drive.google.com/file/d/13W0wz0fPSZptOVU6Zy5SwfhexOmWg-3l/view?usp=sharing
If you are looking for the culprits of this fraud look no further than the frauds from East Anglia University in the UK, in cohort with Michael Mann, as they were the IPCC’s reviewers. Nothing went past them and if some other scientist submitted a paper that didn’t fit the narrative then it was vetoed out.
They had control over important popular science journals as well and used the legal system and their power to discredit and refuse to supply their computer programs for proper scrutiny.
James Hanson also has some questions to answer over his changing of the mean global temperature as well, as he also stated in various newspaper articles of 59 Deg F, which is 15 deg C. Then in our own SMH, stated that the mean global temp had risen from 14 deg to 14.6 deg C.
So you can plainly see where all the warming is coming from …
???? MANIPULATED DATA ????
The reported July 1988 global average was 59 deg F / 15 deg C, converter available here: https://www.rapidtables.com/convert/temperature/fahrenheit-to-celsius.html
(See picture 3 with F to C conversion and picture 4 with newspaper article)
https://news.google.com/newspapers?nid=1915&dat=19880705&id=kKMtAAAAIBAJ&sjid=9HEFAAAAIBAJ&pg=4970,774657
Below is archived newspaper articles of James Hanson formerly of NASA stating 15 deg c (59f) mean global temperature and then an article in the Sydney Morning Herald stating 14 deg C.
January 1992 article stating 59 deg F, i.e. 15 deg C (see picture 5 with news article PDF on google drive link)
https://news.google.com/newspapers?id=S2xGAAAAIBAJ&sjid=7ugMAAAAIBAJ&pg=4134,2440761&dq=helene+wilson+59+fahrenheit+hansen&hl=en
The Sydney Morning Herald with James Hanson’s 14 deg mean rising to 14.6 deg C global temperature claims, in December 2002 (see picture 6)
https://www.smh.com.au/world/global-warming-blamed-for-heat-20021214-gdfyre.html
In May 1996, Michael Mann’s claim of a 15 deg C mean global temperature in a joint science paper, see page 2 of 4:
http://www.meteo.psu.edu/holocene/public_html/shared/articles/MannPark1996GRL.pdf
Another article from 2018 stating a 14.9 deg C average temperature (see picture 8).
Notice they state an “ESTIMATED” 57 deg F as a historical reference, yet as we see the historical reference has always been 59 deg F / 15 deg C, until they started “homogenising” data (FRAUDULENTLY COOLING THE PAST).
https://www.space.com/17816-earth-temperature.html
To check the current global average temperature for yourself, which is 13.88 deg C. (see picture 9) head to the following site. This web site is a live feed of global temperatures, a word from the creators:
http://temperature.global/?fbclid=IwAR1z89hYDx4rxfr6AN7WSzsTeiwR7li2GIaiAylZb8XbhXVyFkmUaFmVzjs
“Temperature.Global calculates the current global temperature of the Earth. It uses unadjusted surface temperatures.
The current temperature is the 12M average mean surface temperature over the last 12 months compared against the 30 year mean.
New observations are entered each minute and the site is updated accordingly.
This site was created by professional meteorologists and climatologists with over 25 years experience in surface weather observations.”
Data sources: “NOAA Global METARs , NOAA One-Minute Observations (OMOs) , NBDC Global Buoy Reports , MADIS Mesonet Data” (see picture 10).
Here’s an interesting thought. I watch birds. Every year in my home in Upstate New York, where I have mowed my lawn for the last 45 years, the American Robin have returned to our area (the vast majority, about 5% stay in the North eating dried berries etc) between March 5 and March 9. I always wondered why. Then I read from an expert orinthologist that Robins migrate North due to the 37 degree isotherm, i.e. they follow the average temperature pattern northward in order to eat worms as they begin to come out of the soil. If our climate is warming, then why haven’t the Robins been coming earlier each year? Today is March 5, 2020 and I haven’t seen them yet!
https://en.wikipedia.org/wiki/Arctic_sea_ice_decline
So how much ice was there 4Kya when the oceans were six feet higher? If rising seas are indicative of ice melt, the first start of ice formation was 4Kya in this inter-glacial, and we are just seeing a fluctuation about an increasing mean for the past few thousand years.
… since 1979.
Thanks for the fraudulent cherry pick Kneel. Get back to us when you have any useful info to share.
Decline from the highest extent since the Little Ice Age
https://i.postimg.cc/4x4xCnCd/Icelandic_sea_ice_index_2.png
And still far higher than the normal for the last 10,000 years, probably still in the TOP 5% or so.
There is ONE HECK OF A LOT of sea ice up there. !
LOL. Neal, are you trying to educate Tony?
Stop drinking the Kool Aid and trying to protect your crumbling Climate Change paradigm and face your eventual disillusionment like a man.
Wikipedia??
I never go there. Controlled by one person. A Joke.
I have been checking the temperature in Arctic Bay for the past six weeks using my regular iPhone app. It has been a consistent -36 c . The highest ‘general’ temperature in Antarctica has been ( according to the same app) as been -20C in their midsummer with midnight sun for most of day and night. As it heads towards Antarctic winter the temperatures forecast are -45c with today being -41c. If course the MSM went crazy when the highest temperature recorded ‘in Antartica’ was recorded at @18C whilst neglecting to inform the public that the Esperanza station was a peninsula 2000 miles North of the actual South Pole. That was the equivalent of recording midsummer temperatures in Iceland!
Balmy -36 c in Cambridge bay this hour
Anyone want to wager that Climate Alarmist Jim, aka The Diminutive Pale Con, whose commentary is missing in this post, will be back again after the next spike?
Thank your for your clear thinking and straightforward scientific analysis.
I’d be interested in your opinion on the points made by this geologist; to me they seem in-line with the points you make but from a different view:
https://www.researchgate.net/publication/332245803_29_bullet_points_prove_global_warming_by_the_sun_not_CO2_by_a_GEOLOGIST_for_a_change
Apologies if you’ve already covered this.