NOAA’s Climate Extremes Index shows summer afternoon temperatures much above normal are affecting more and more of the US, with the past decade was highest on record.
They show an upwards trend beginning around fifty years ago.
U.S. Climate Extremes Index (CEI) | Extremes | National Centers for Environmental Information (NCEI)
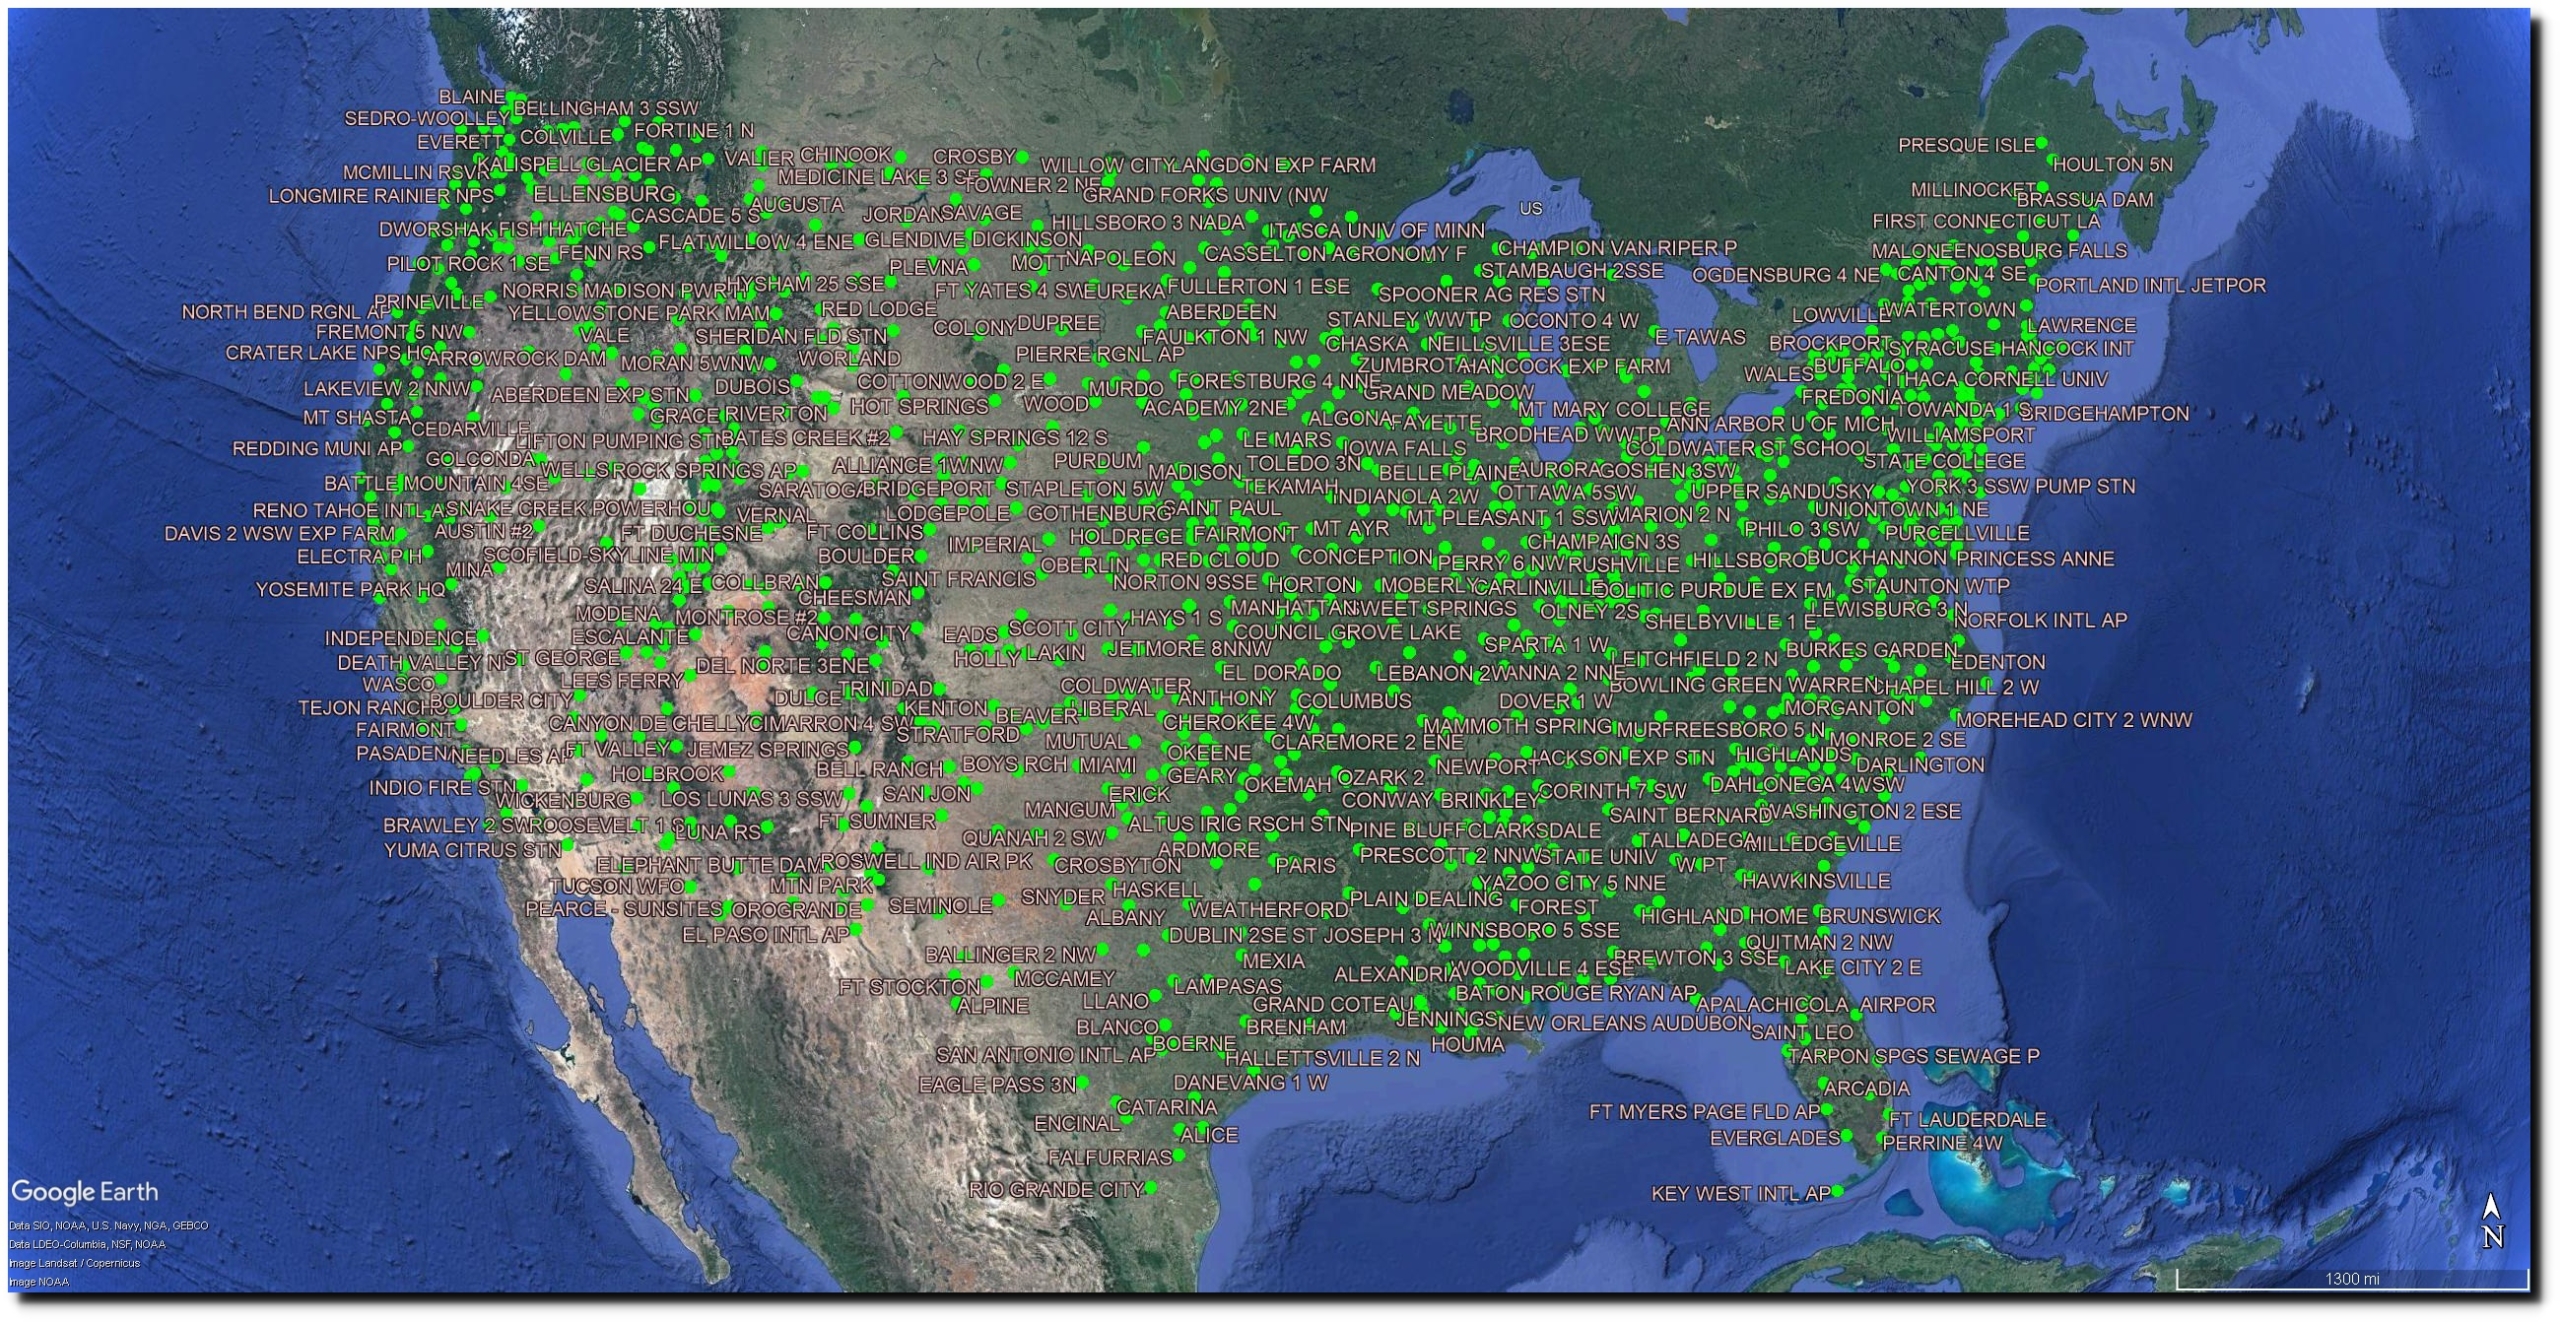
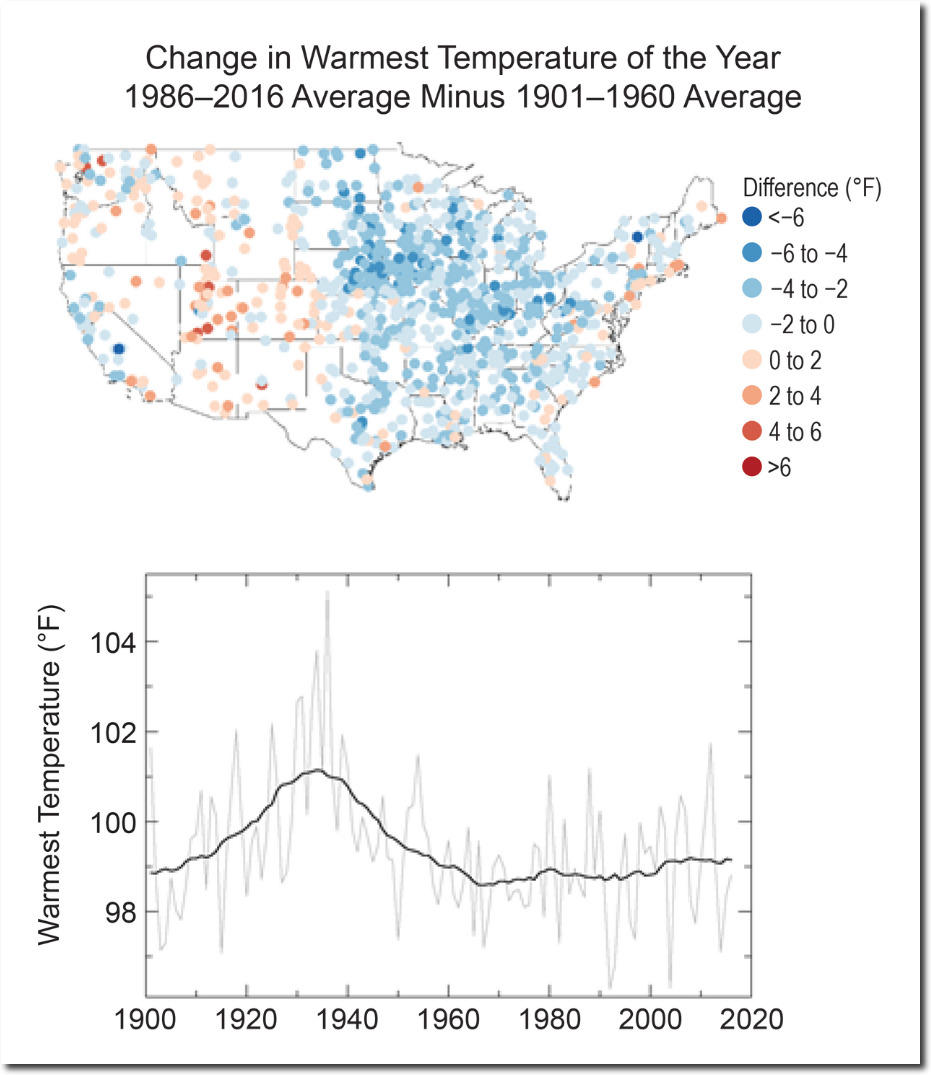
But their thermometer data shows the exact opposite, as does the National Climate Assessment. There are 1,218 stations in the United States Historical Climatology Network.
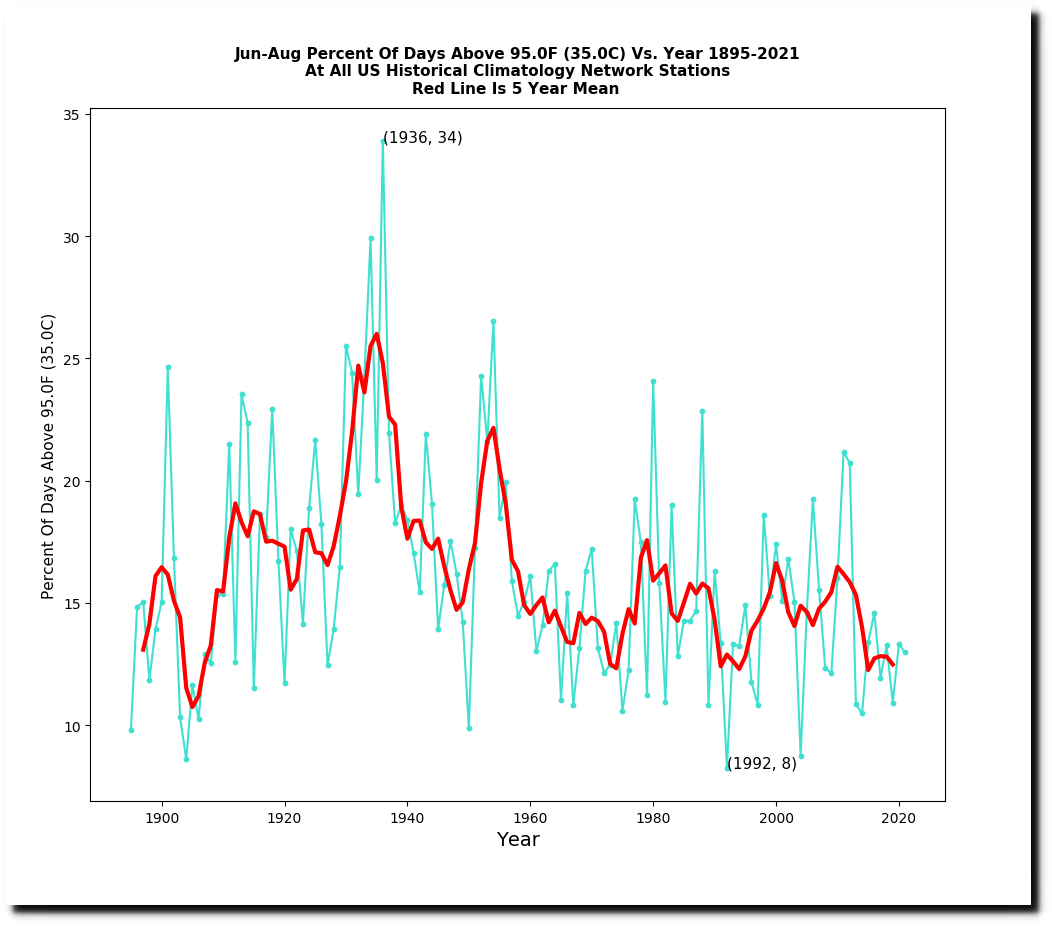
The percentage of stations reaching 95F sometime during the summer has declined sharply over the past ninety years.
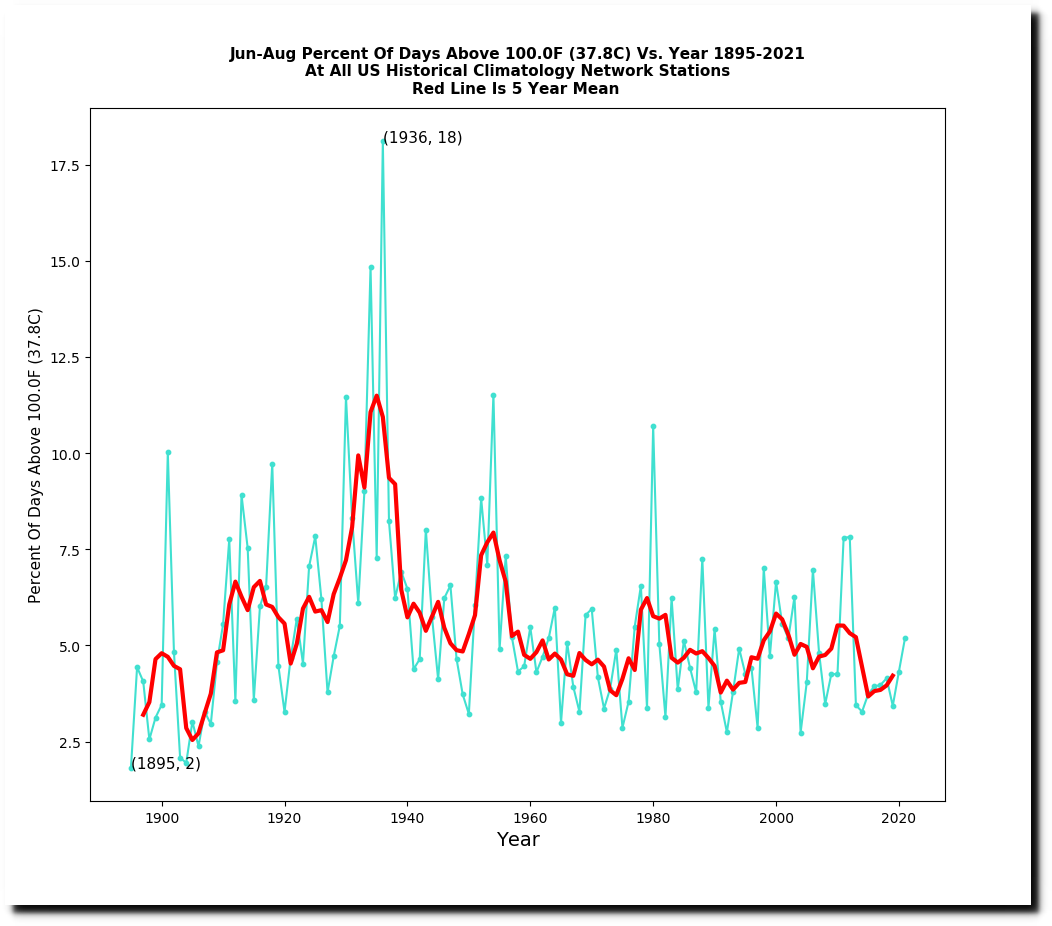
So has the frequency of hot days.
Temperature Changes in the United States – Climate Science Special Report
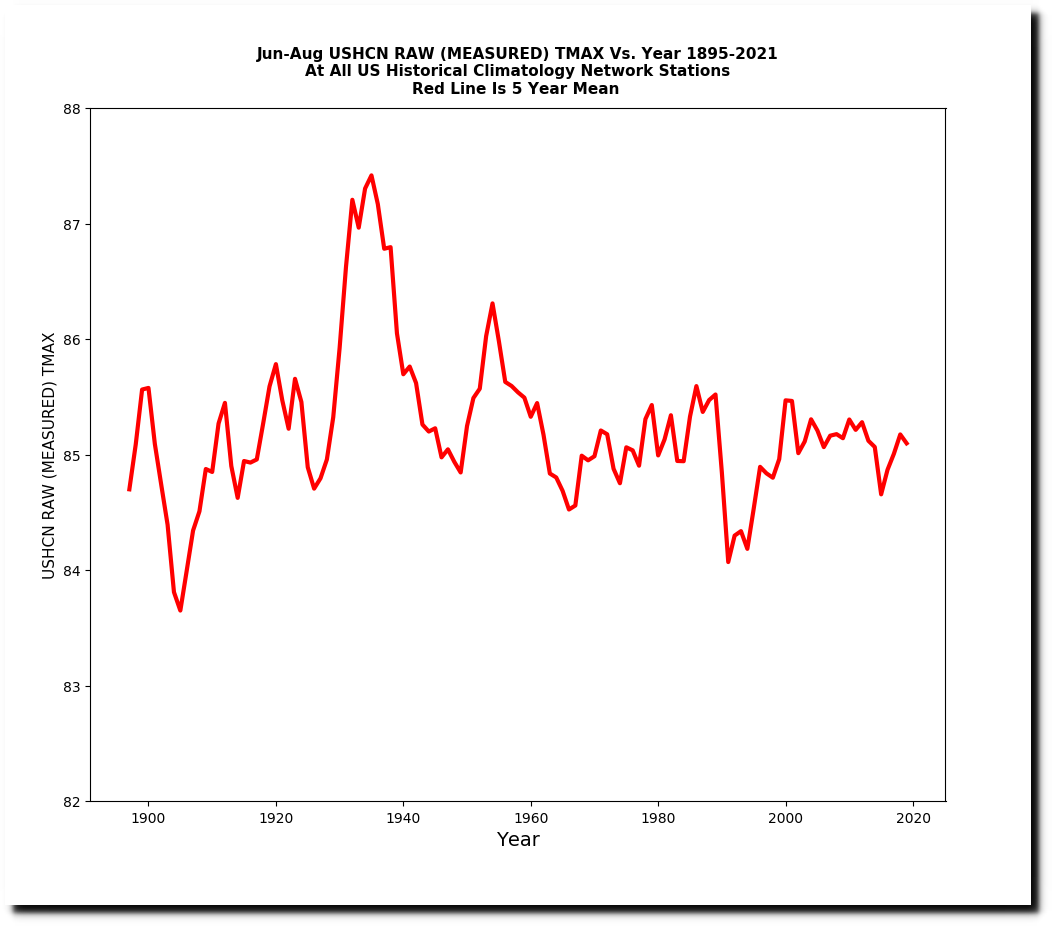
Here is how they reversed the trend. This is the NOAA daily temperature data for the US.
ftp://ftp.ncdc.noaa.gov/pub/data/ghcn/daily/ghcnd_hcn.tar.gz
Their raw monthly data set is nearly identical.
ftp://ftp.ncdc.noaa.gov/pub/data/ushcn/v2.5/ushcn.tmax.latest.raw.tar.gz
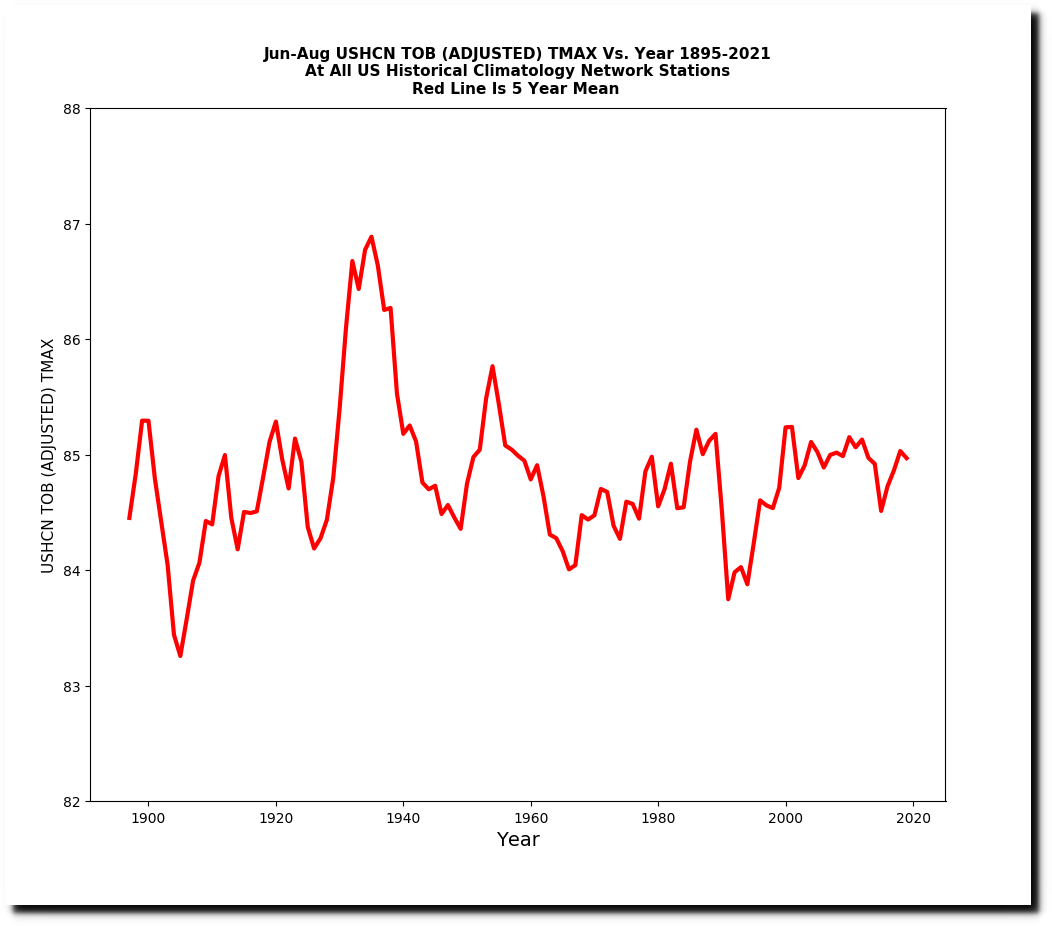
Time of Observation Bias adjusted data is not much different.
ftp://ftp.ncdc.noaa.gov/pub/data/ushcn/v2.5/ushcn.tmax.latest.tob.tar.gz
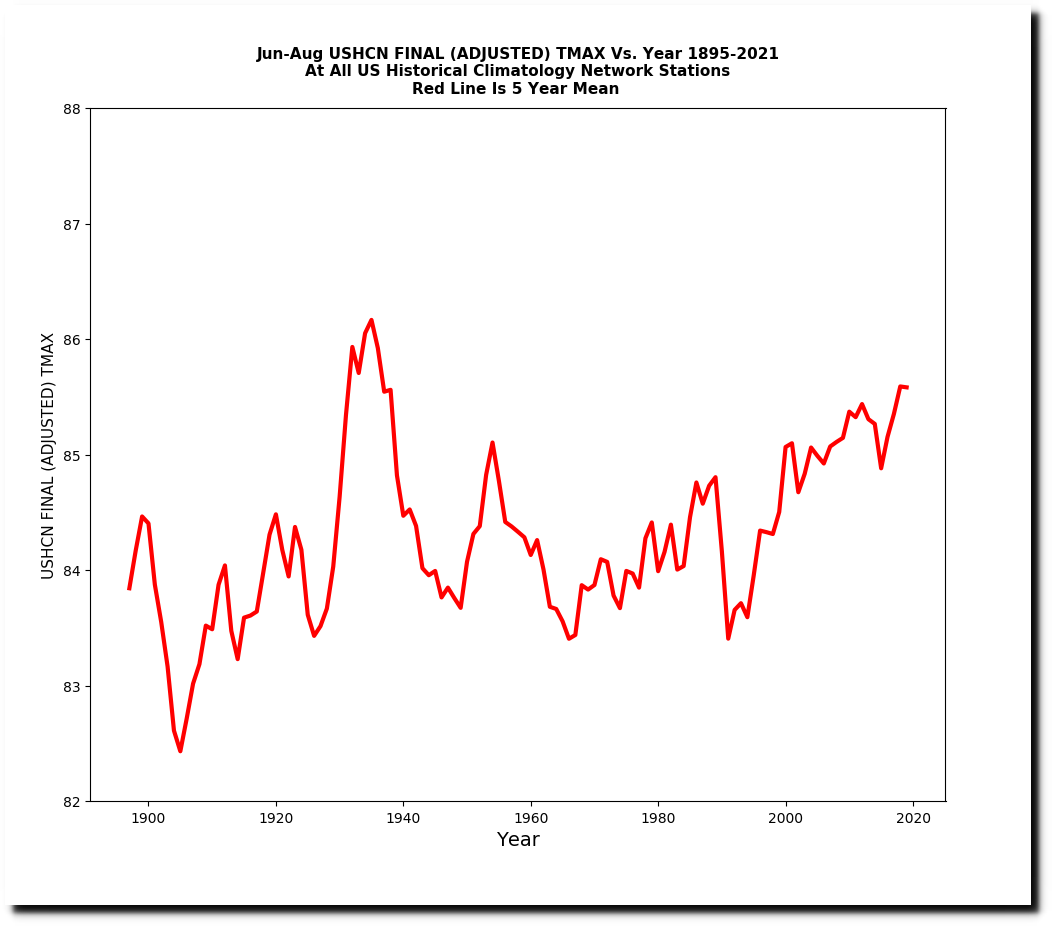
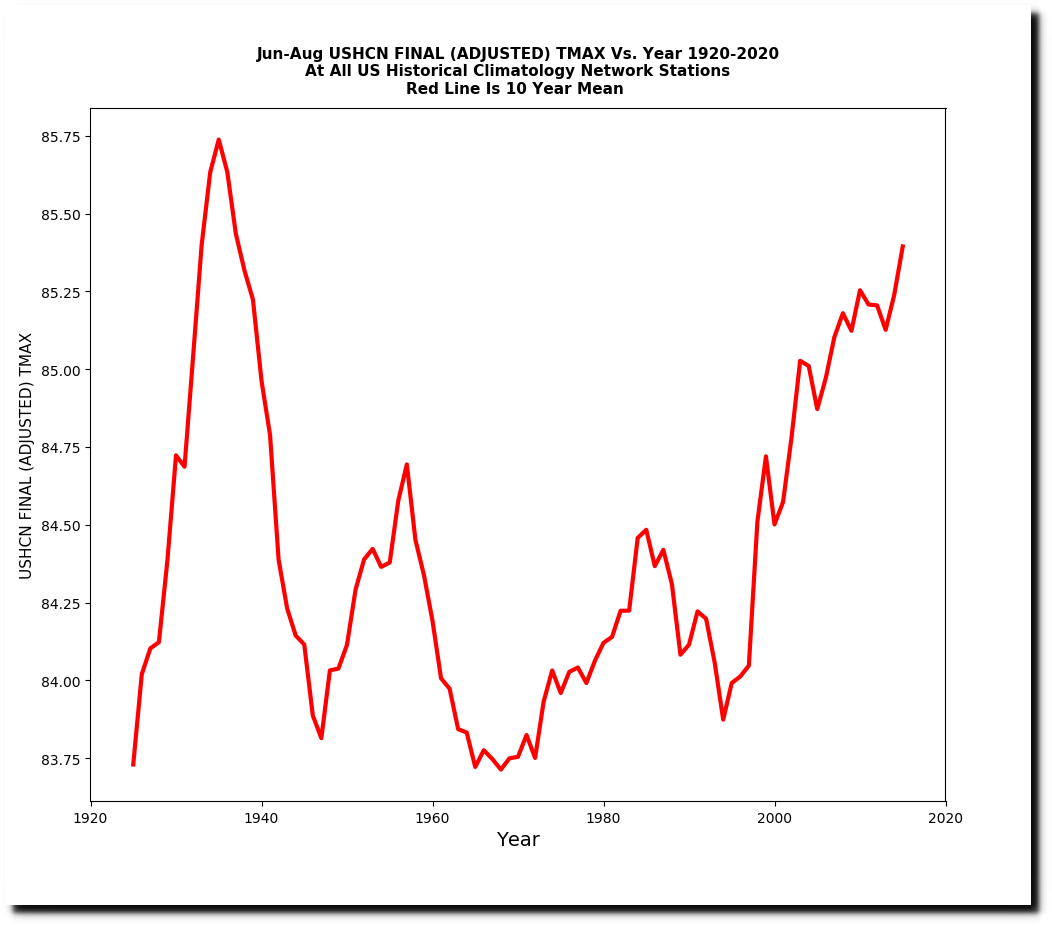
But the final adjusted data set shows a strong warming trend over the past fifty years.
ftp://ftp.ncdc.noaa.gov/pub/data/ushcn/v2.5/ushcn.tmax.latest.tob.tar.gz
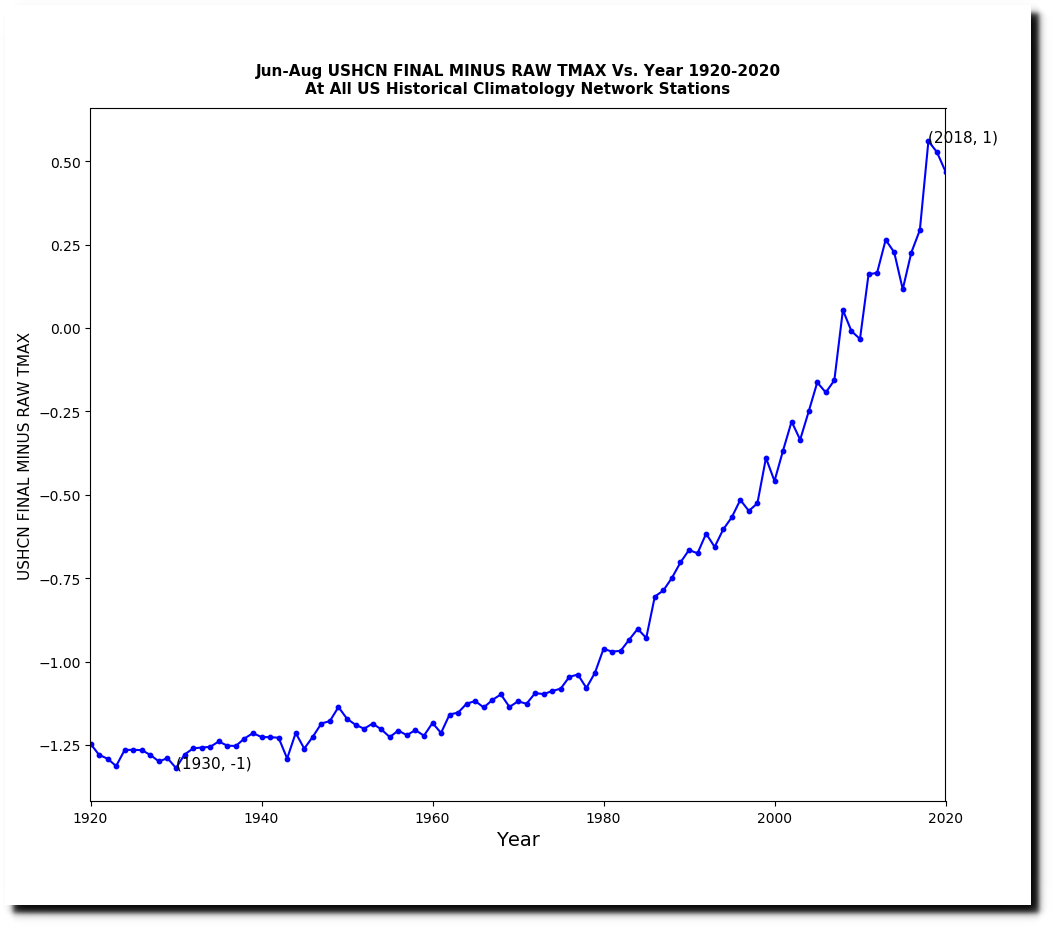
The final data set has diverged from the measured data by almost two degrees over the past forty years.
This warming trend since 1970 does not exist in the thermometer data, so where does it come from?
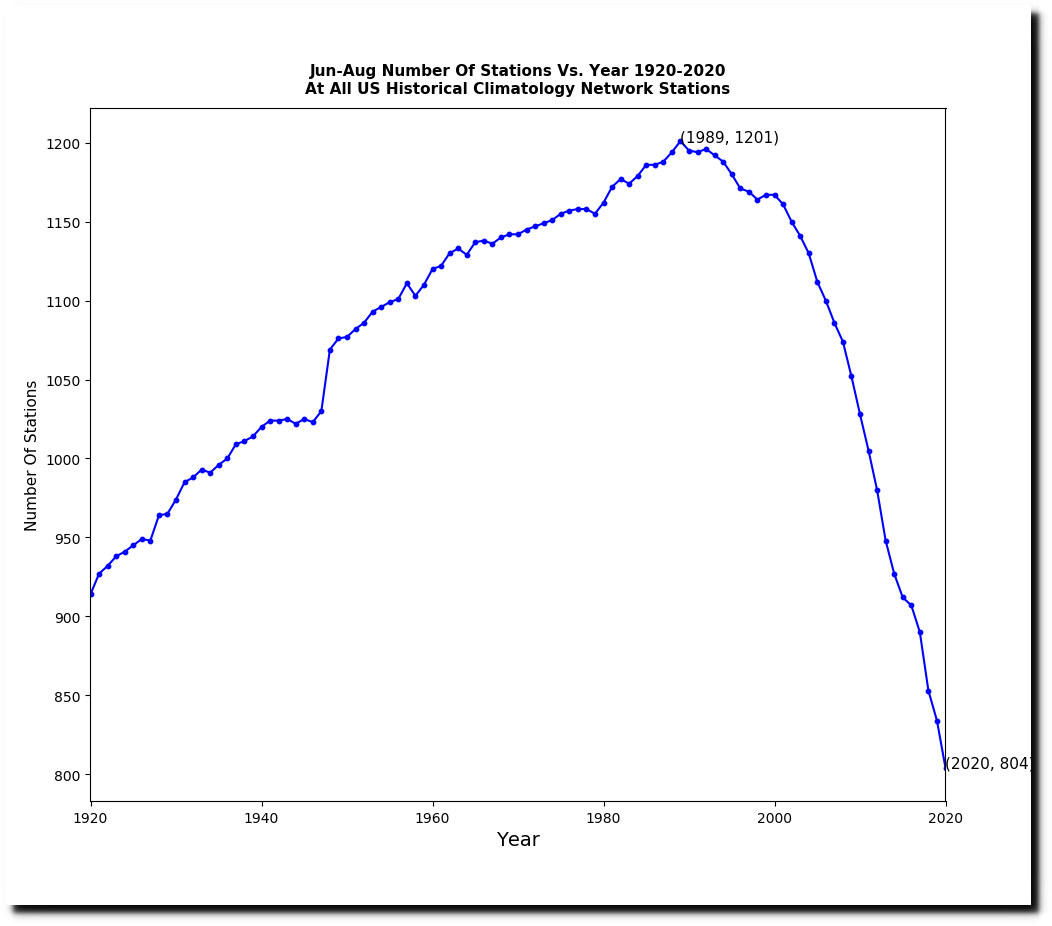
There has been a large decrease in the number of stations reporting data over the past 30 years. But in the final adjusted data set, they use temperatures for all 1,218 stations regardless of whether or not there is actually any thermometer data.
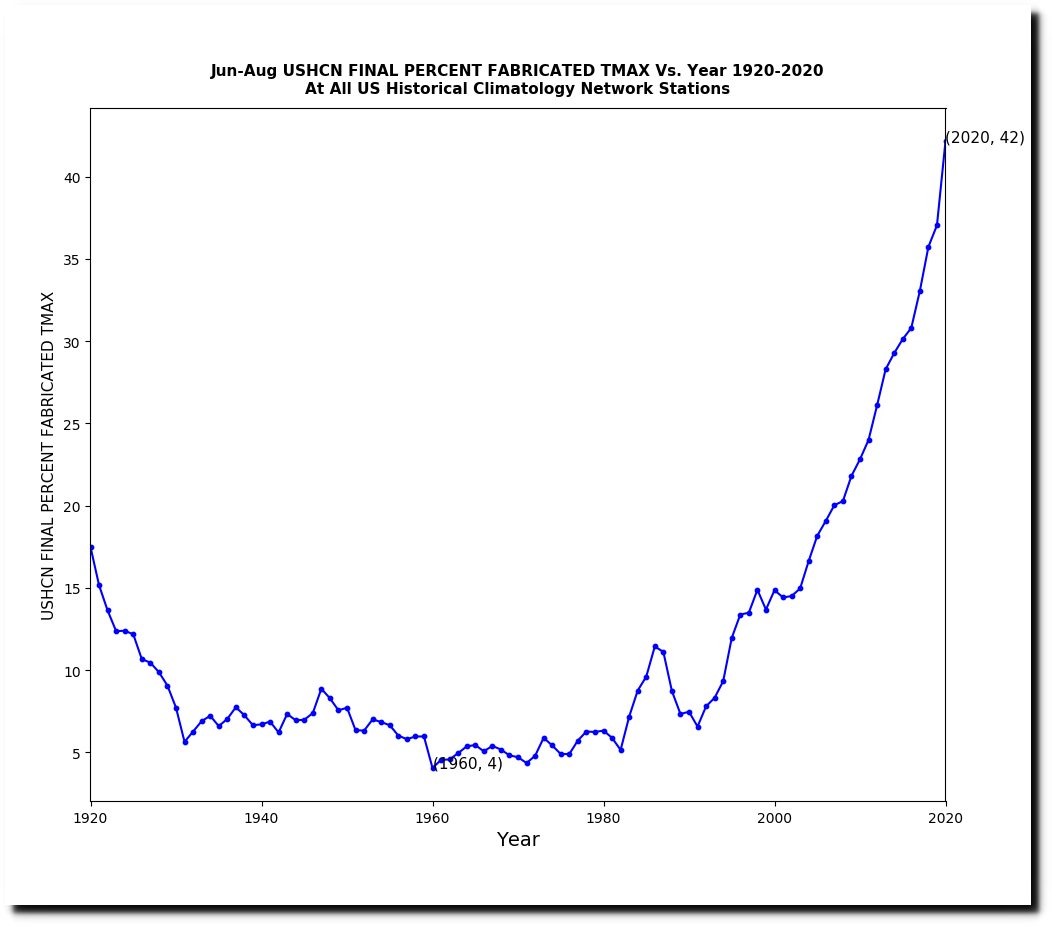
In other words, they are simply making up data. More than 40% of the data in the final data set is now fabricated.
The fabricated data has three degrees of warming, and that accounts for the entire warming trend.
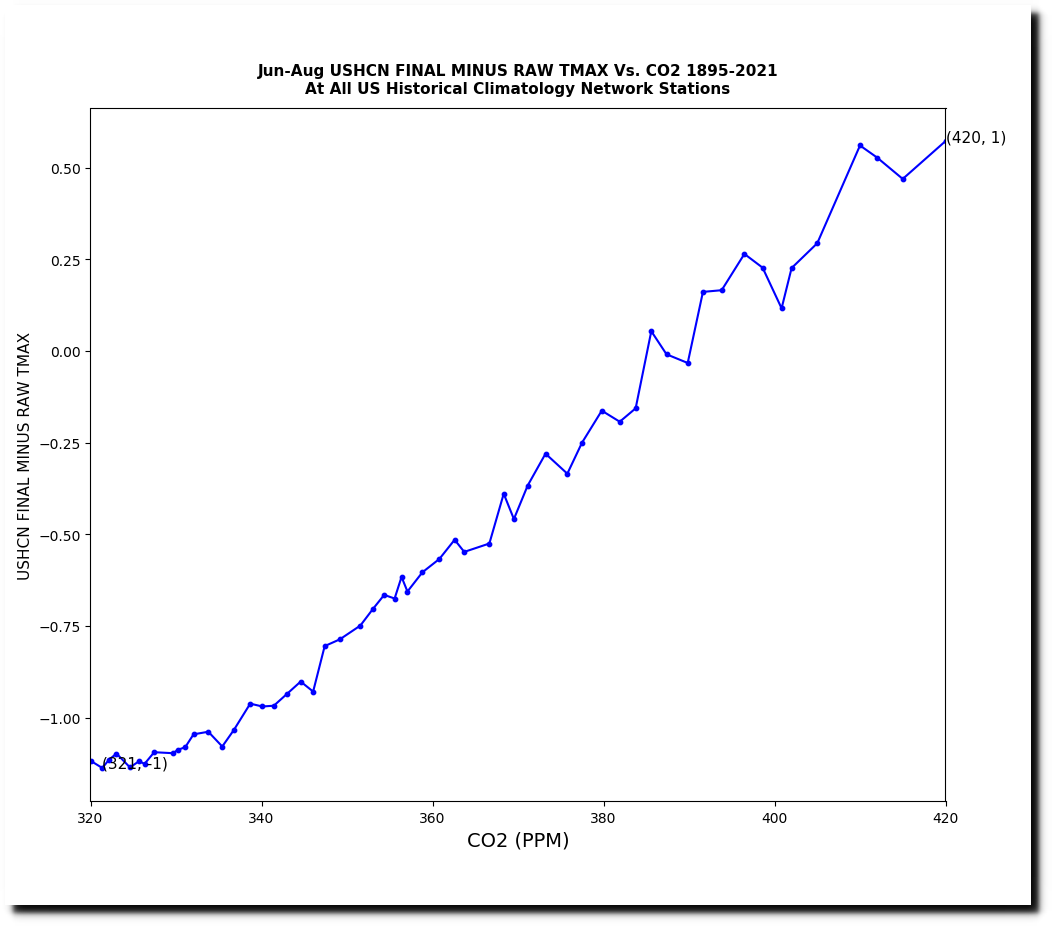
NOAA US temperature graphs are completely fraudulent, and they are being adjusted upwards to track CO2.
Long ago I read some of the early Global Warming papers. The thing that stuck out then wasn’t that the writers were crooks, it was that they were duds.
But soon dishonesty was thriving. A gravy train always attracts such people, I suppose.
So data is treated the same way as votes.
Existing informations are
being replaced by adjusted and made up data
and have to pass the communistic filter of truth until the results fit
the billionai…..official version.
And it seems that the cooling trend is so strong that a decrease of high altitude
stations and the systematic replacement of its data with warmer low altitude data is no longer enough to get the desired armageddon.
Fraud has become a business model in the United States and it starts with the federal government
They bank on no one checking it, and demonize anyone who does.
Do they ever explain their methodology in papers? Does anyone ask the scientists who put this together to explain? There must be a review process. Checks and balances?
The way they locate and run the recording stations, there is no way they can tell the difference heat sources unrelated to CO2 in the atmosphere. Nuclear power plants, the interstate highway (even without traffic), solar panels, wind turbines, parking lots and other paved areas, the electric distribution system, wastewater treatment plants, cities, heat from the earth itself, large hydro projects( all electricity produces heat) . I think it’s reasonable to suspect fraud.
“The percentage of stations reaching 95F sometime during the summer has declined sharply over the past ninety years.”
And, that’s in spite of the ever worsening Urban Heat Island Effect.
NOAA: “highly developed urban areas can experience mid-afternoon temperatures that are 15°F to 20°F warmer than surrounding, vegetated areas. ”
EPA: On average, the difference in daytime sur-face temperatures between developed and rural areas is 18 to 27°F (10 to 15°C); the difference in nighttime surface tempera-tures is typically smaller, at 9 to 18°F (5 to 10°C).
The UHIE can be a killer. Not AGW.
The only man-made warming/CC that a human being can possibly feel/experience is that from the UHIE. With the so-called consensus being that most of GW since the 1970’s is man-made (what is that 55% of 0.5C, or 0.275C), no human can feel such an average global change over the course of their lifetime.
Now if one moves from Boston to Miami, yes – they can certainly feel the average change with that.
“The percentage of stations reaching 95F sometime during the summer has declined sharply over the past ninety years.”
And, that’s in spite of the ever worsening Urban Heat Island Effect.
NOAA: “highly developed urban areas can experience mid-afternoon temperatures that are 15°F to 20°F warmer than surrounding, vegetated areas. ”
EPA: On average, the difference in daytime sur-face temperatures between developed and rural areas is 18 to 27°F (10 to 15°C); the difference in nighttime surface tempera-tures is typically smaller, at 9 to 18°F (5 to 10°C).
The UHIE can be a killer. Not AGW.
The only man-made warming/CC that a human being can possibly feel/experience is that from the UHIE. With the so-called consensus being that most of GW since the 1970’s is man-made (what is that 55% of 0.5C, or 0.275C), no human can feel such an average global change over the course of their lifetime.
test
Socking! But if this were to be true, legal actions must be taken against it!
Can you proof that temperature data on abandoned temperature recording stations are intact fabricated (modeled) while presented as actual temperature measurements?
What do I use to open these .gz files? I can’t seem to do it.
I think the temp.thing is just a diversion. The global warming people believe that the extra heat produced by humans causes heating of the earth. They do not know where the extra heat resides, but they know it is some place and they continue to look.
Can you provide a summary of the deleted stations e.g. all warm locations cold, or a urban, or mixed? Just want more ammo for the alarmists