
Seven years ago a “climate scientist” said we needed to debate with facts and truth. He cited promises from China and temperature graph from NASA as being those.
“The 1930s were warm in the United States, but they were cool globally. In fact, your readers can see that data for themselves at the NASA website”
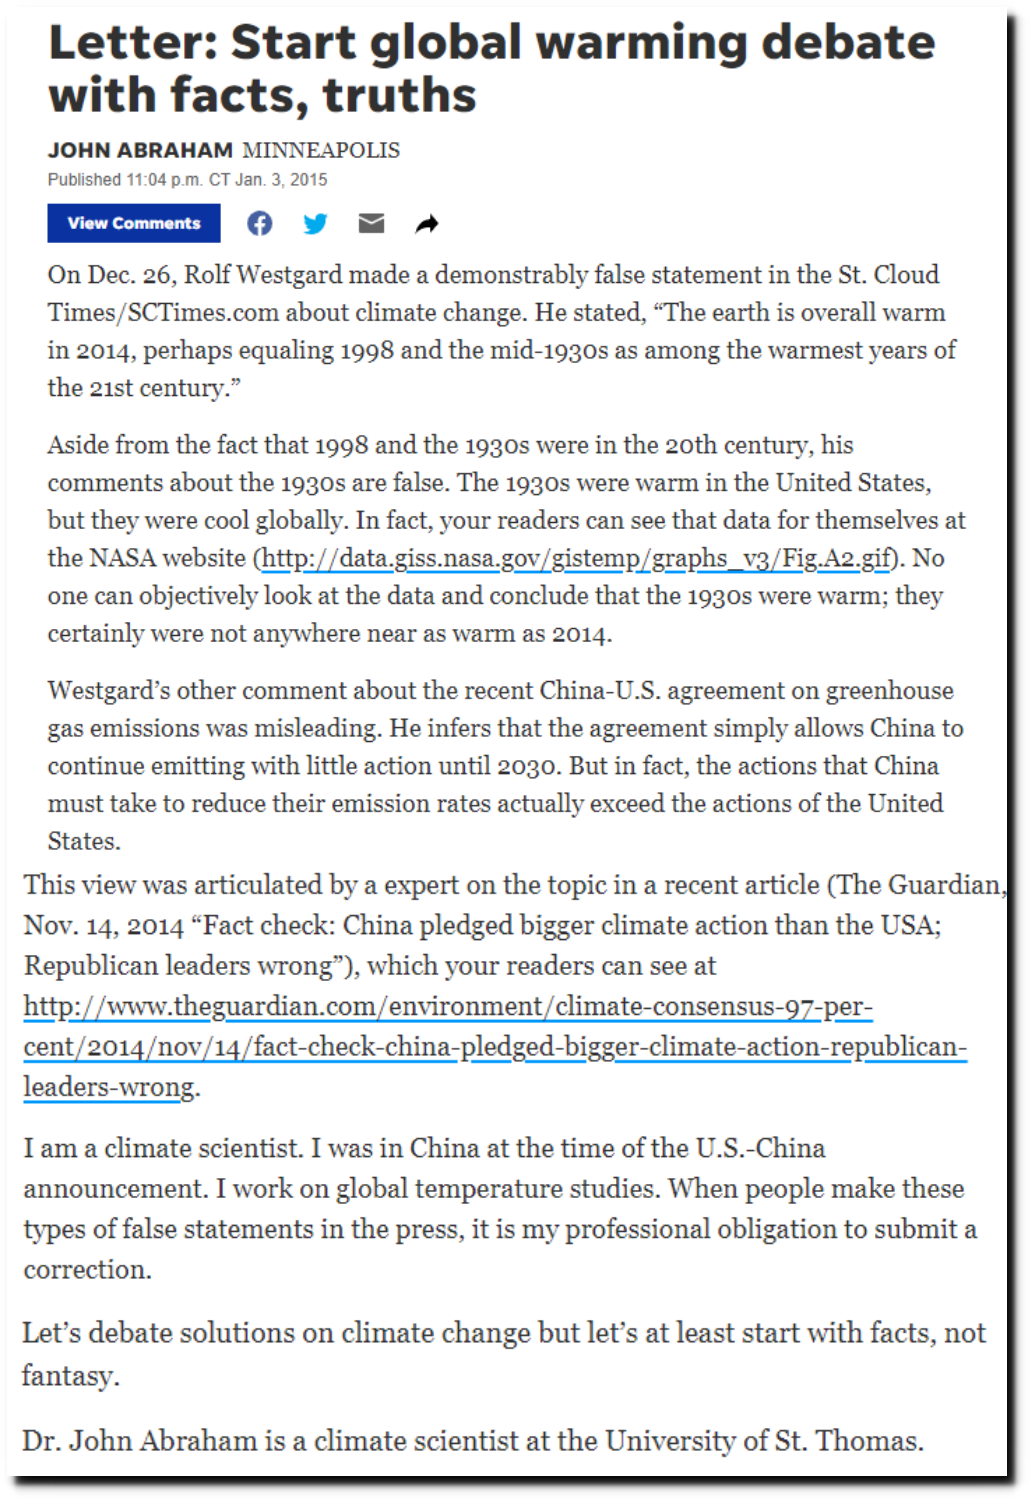 Letter: Start global warming debate with facts, truths

China didn’t keep their promises.
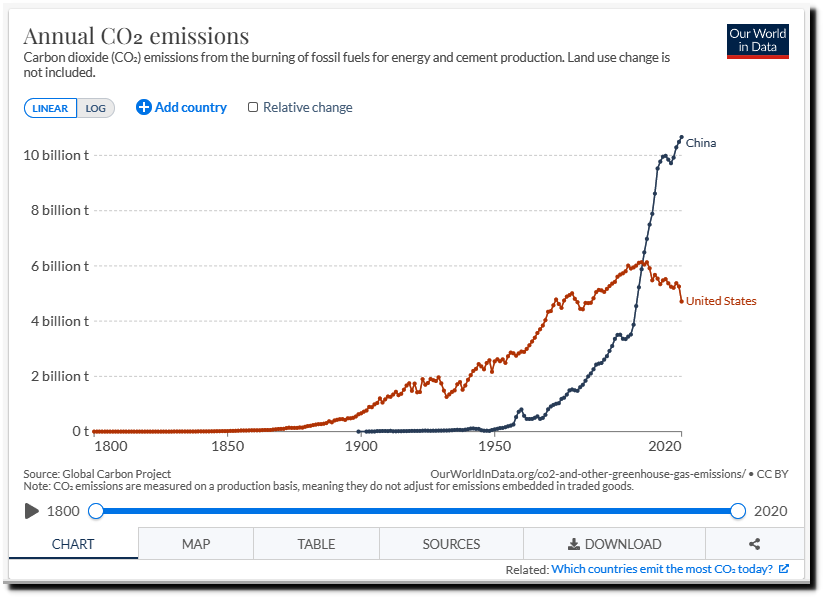
China: CO2 Country Profile – Our World in Data

China Digs More Coal for Power Needs, Despite Climate Change – The New York Times
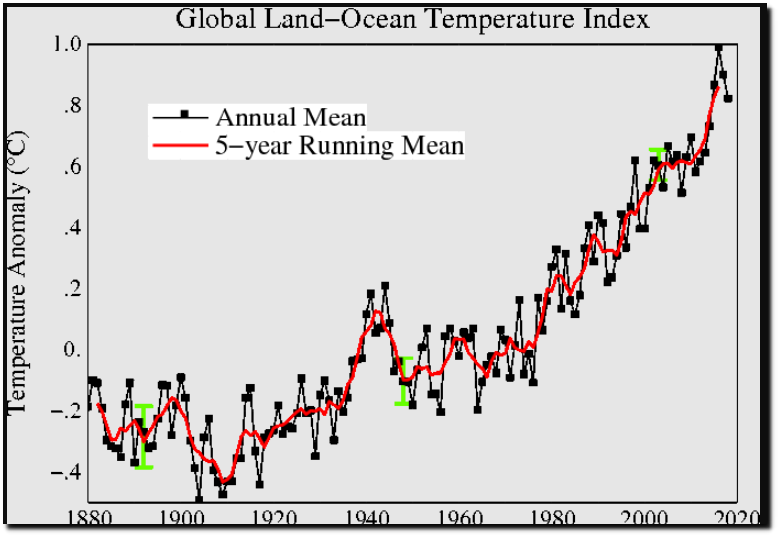
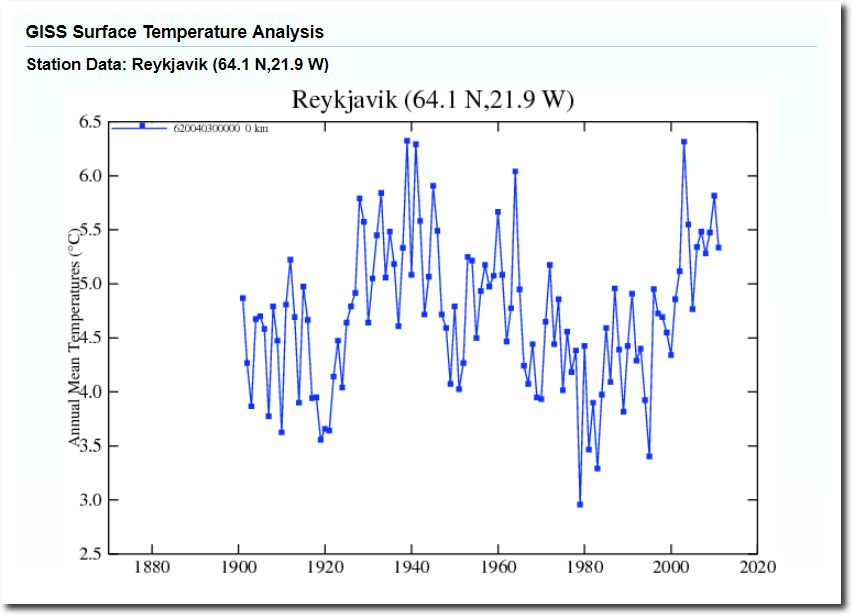
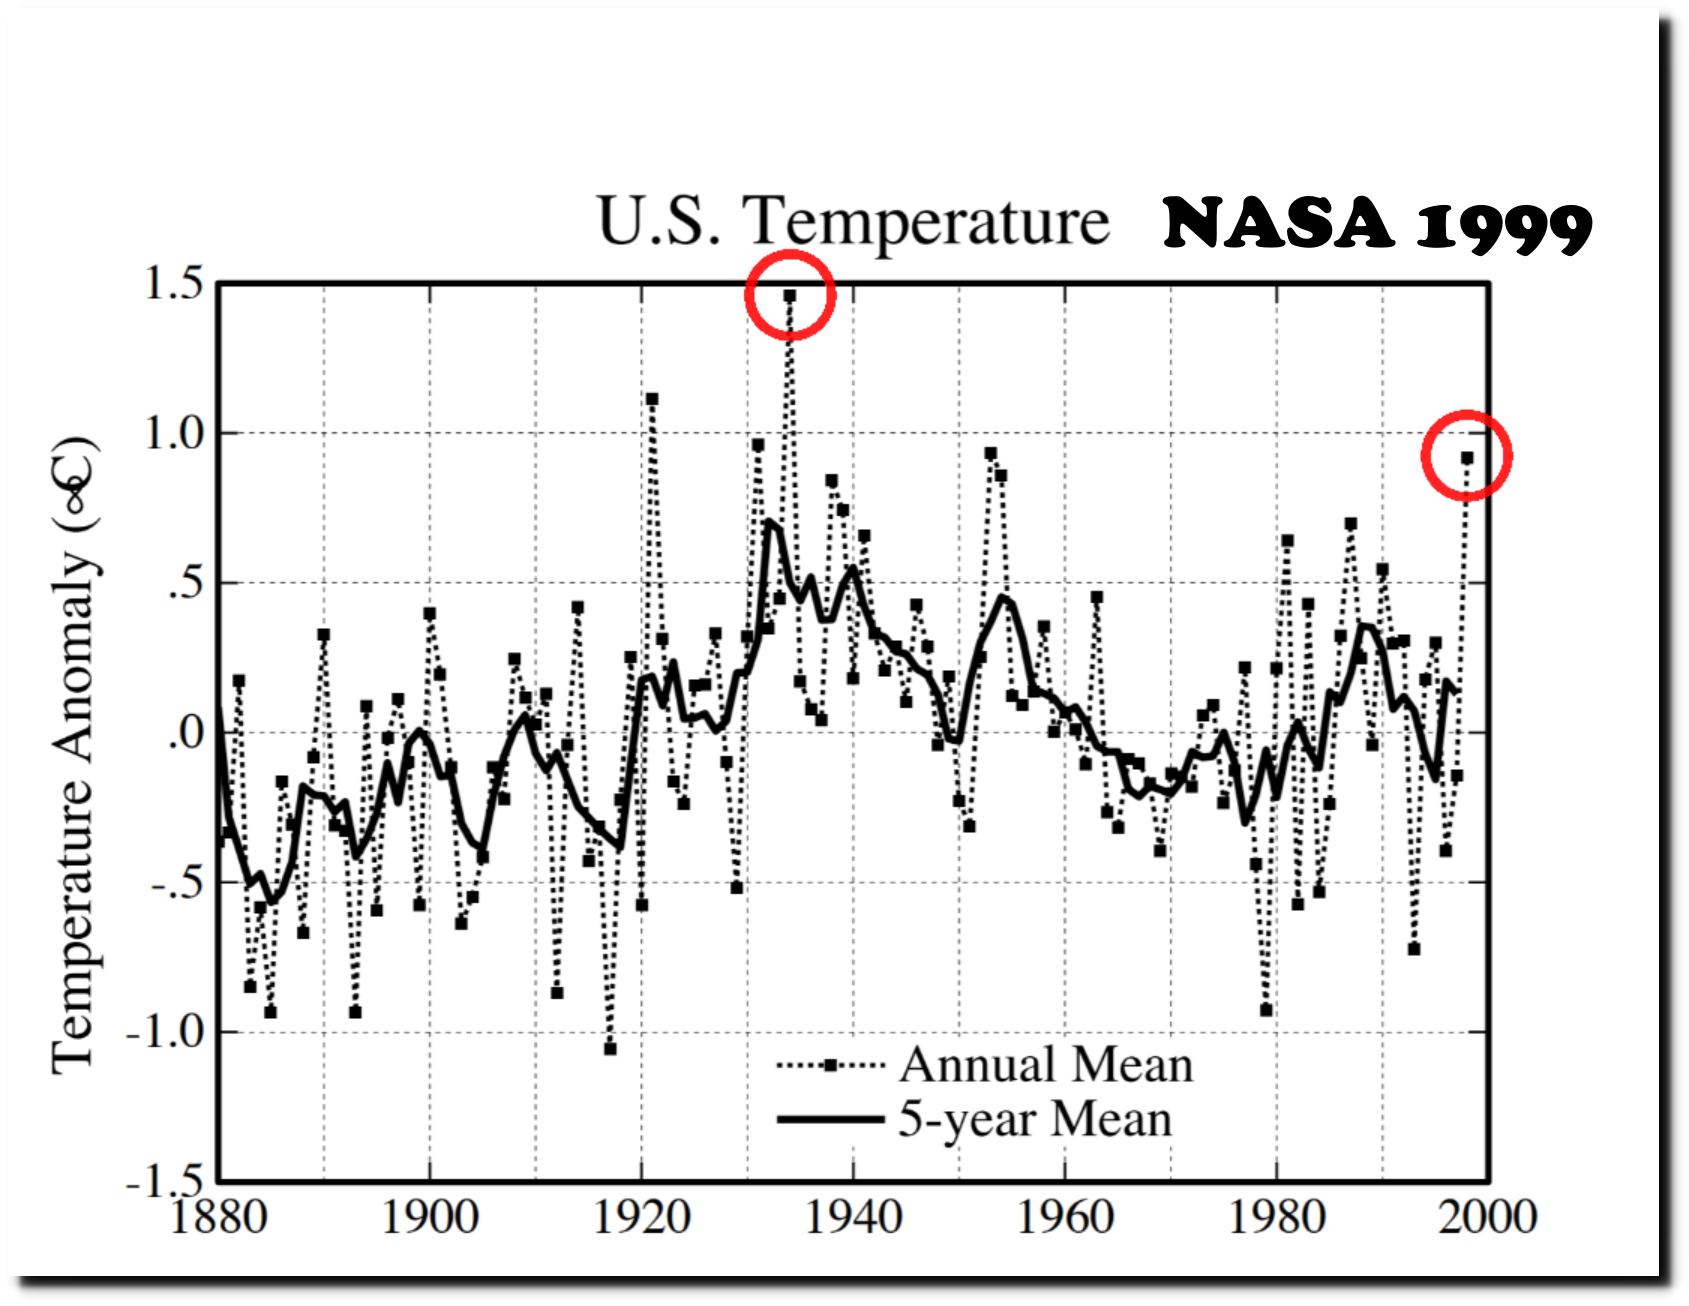
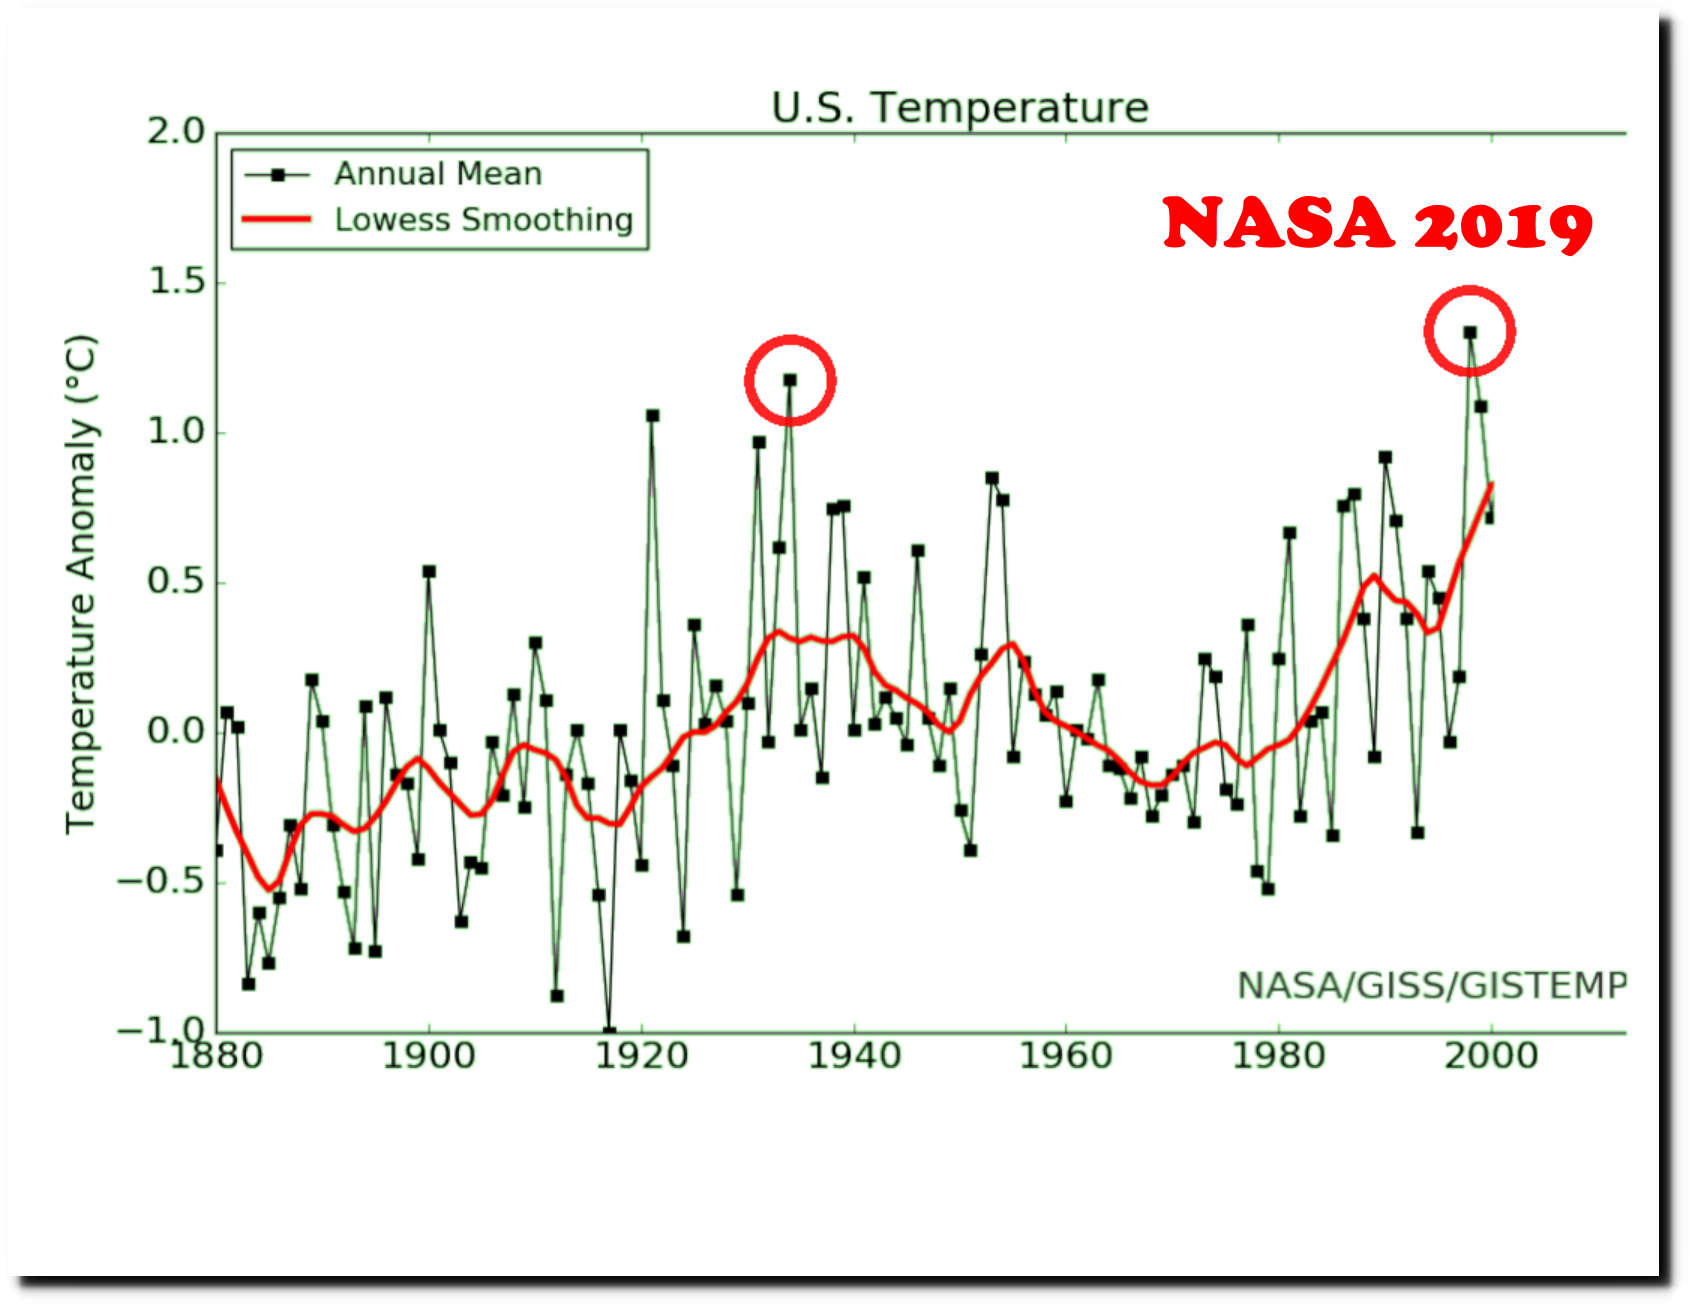
His other evidence was this NASA temperature graph which showed the 1930s as being cold.
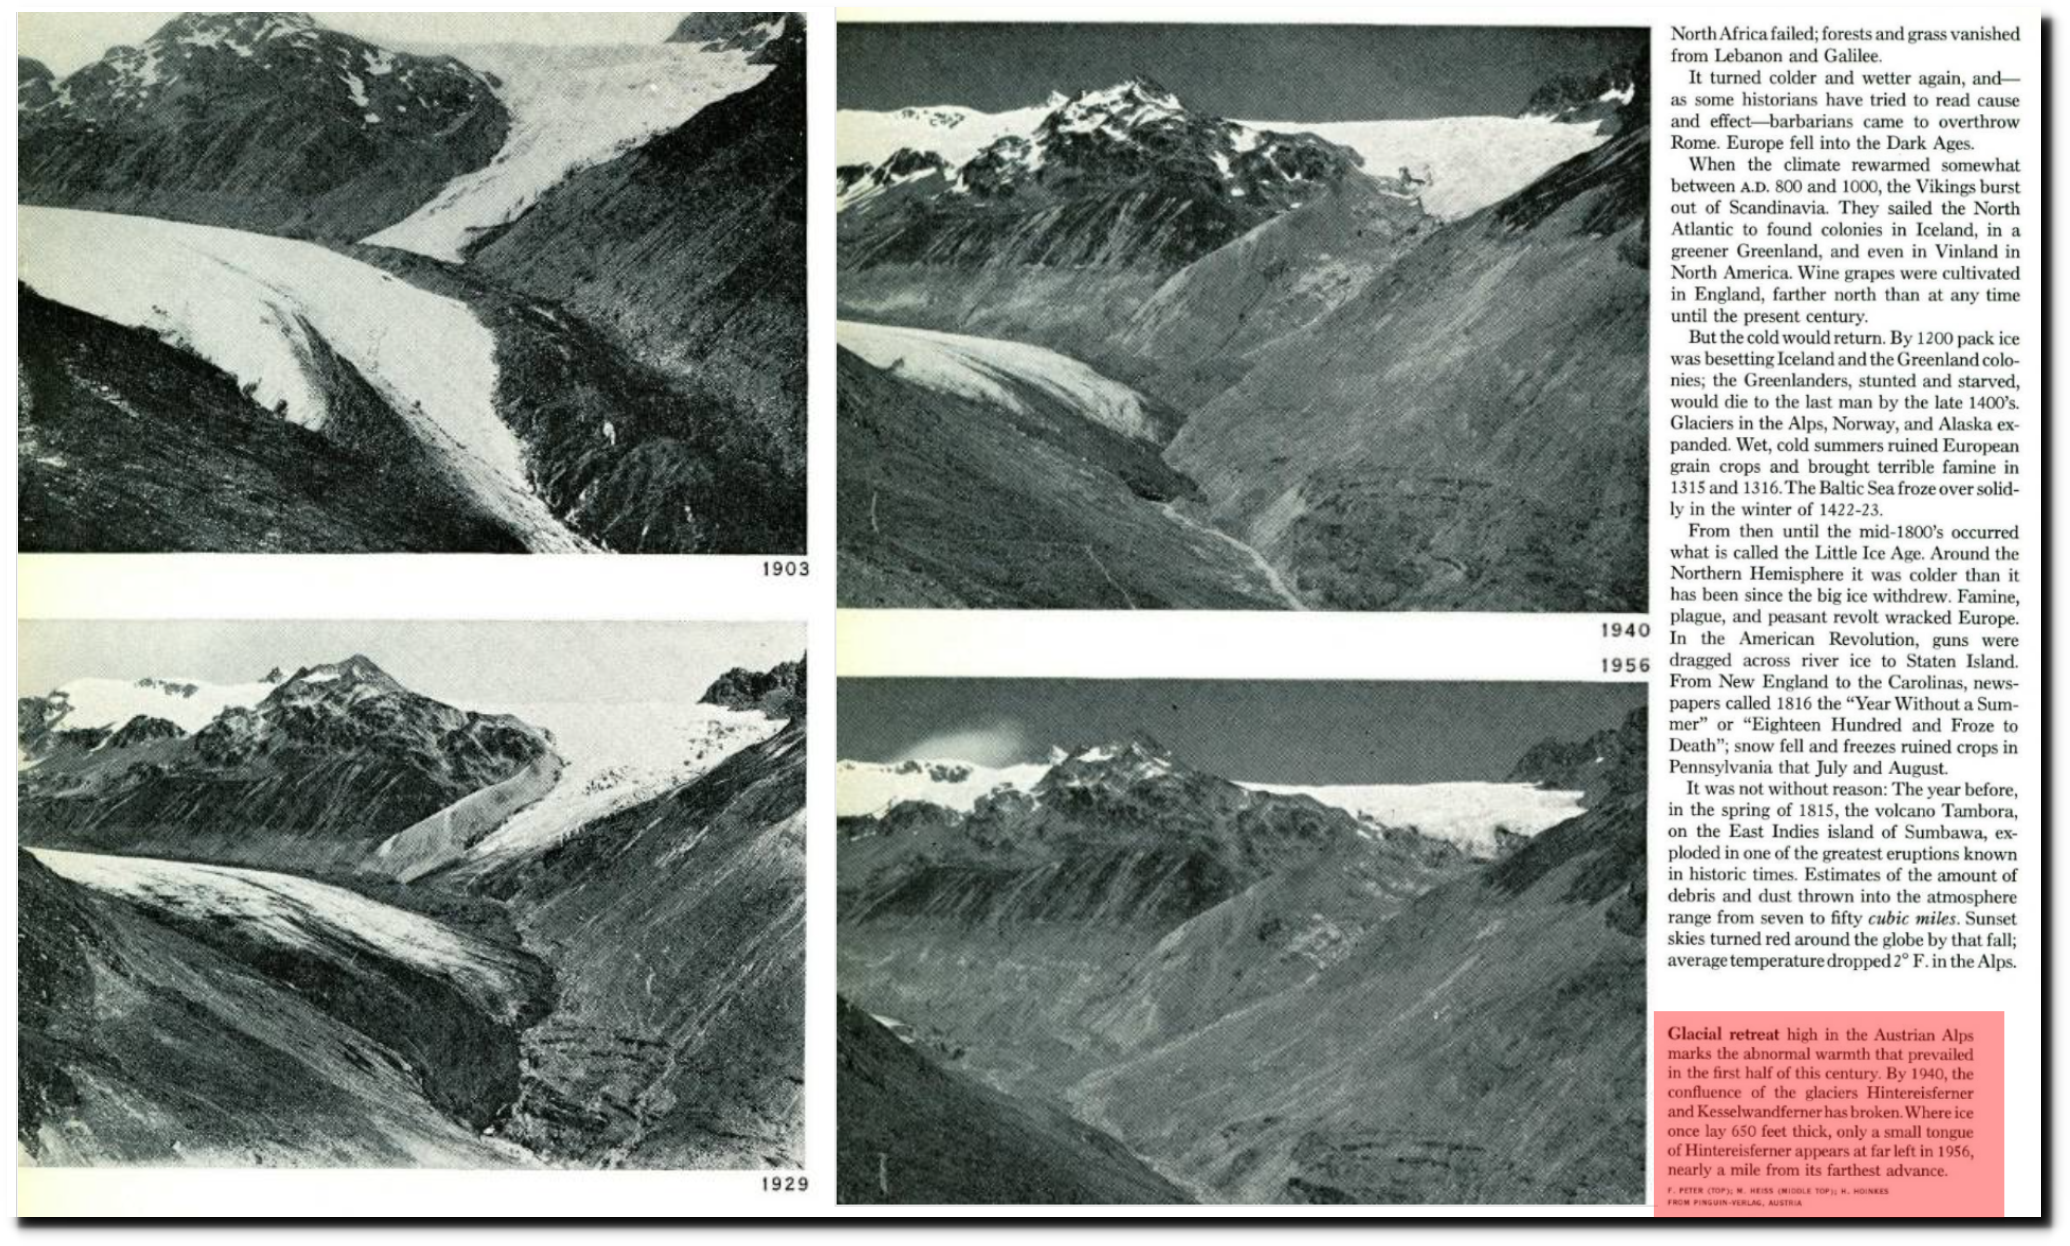
National Geographic Magazine Archive
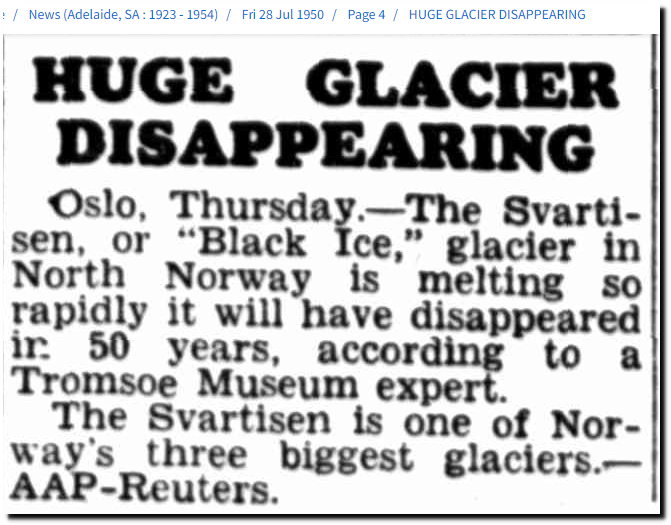 28 Jul 1950 – HUGE GLACIER DISAPPEARING – Trove
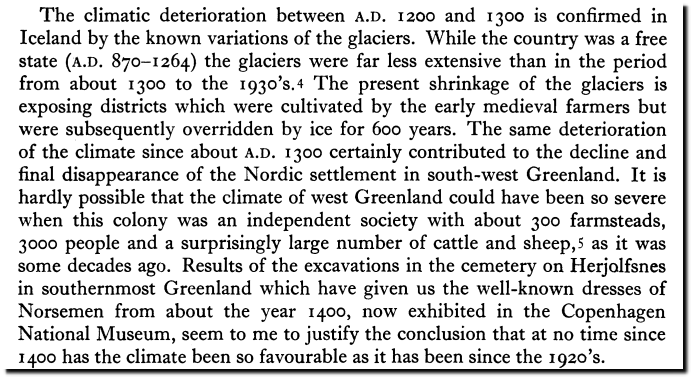
“The climatic deterioration between A.D. 1200 and 1300 is confirmed in Iceland by the known variations of the glaciers. While the country was a free state (A.D. 870-1264) the glaciers were far less extensive than in the period from about 1300 to the 1930’s. The present shrinkage of the glaciers is exposing districts which were cultivated by the early medieval farmers but were subsequently overridden by ice for 600 years. The same deterioration of the climate since about A.D. 130o certainly contributed to the decline and final disappearance of the Nordic settlement in south-west Greenland. It is hardly possible that the climate of west Greenland could have been so severe when this colony was an independent society with about 300 farmsteads, 3000 people and a surprisingly large number of cattle and sheep, 5 as it was some decades ago. Results of the excavations in the cemetery on Herjolfsnes in southernmost Greenland which have given us the well-known dresses of Norsemen from about the year 1400, now exhibited in the Copenhagen National Museum, seem to me to justify the conclusion that at no time since it 400 has the climate been so favourable as it has been since the 192o’s.”
Retreat of the Abrekke glacier in Norway before 1946.

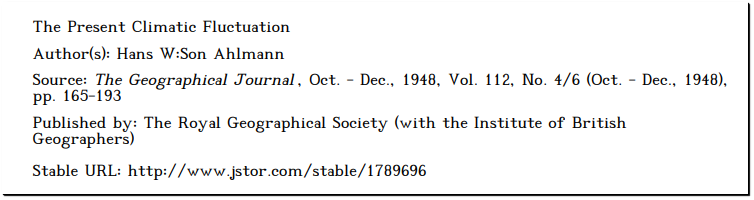
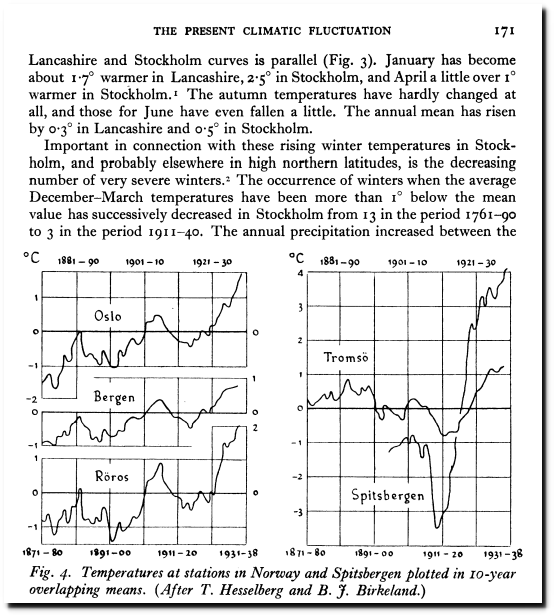
The Present Climatic Fluctuation on JSTOR
Glacier National Park ice free by 1948
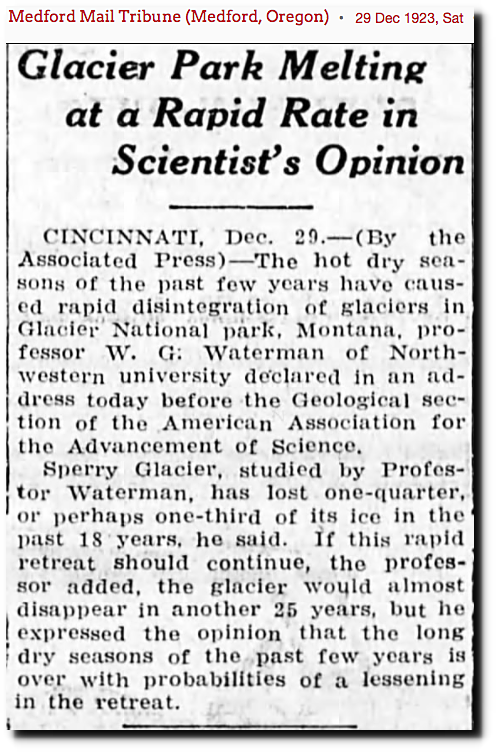
29 Dec 1923, Page 5 – at Newspapers.com
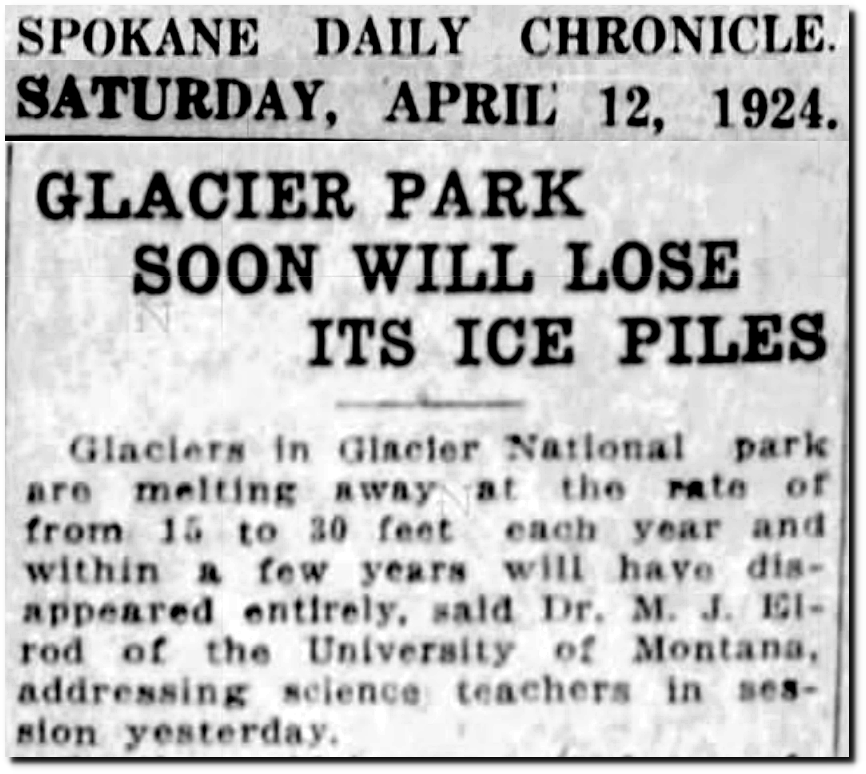
12 Apr 1924, 7 – Spokane Chronicle at Newspapers.com
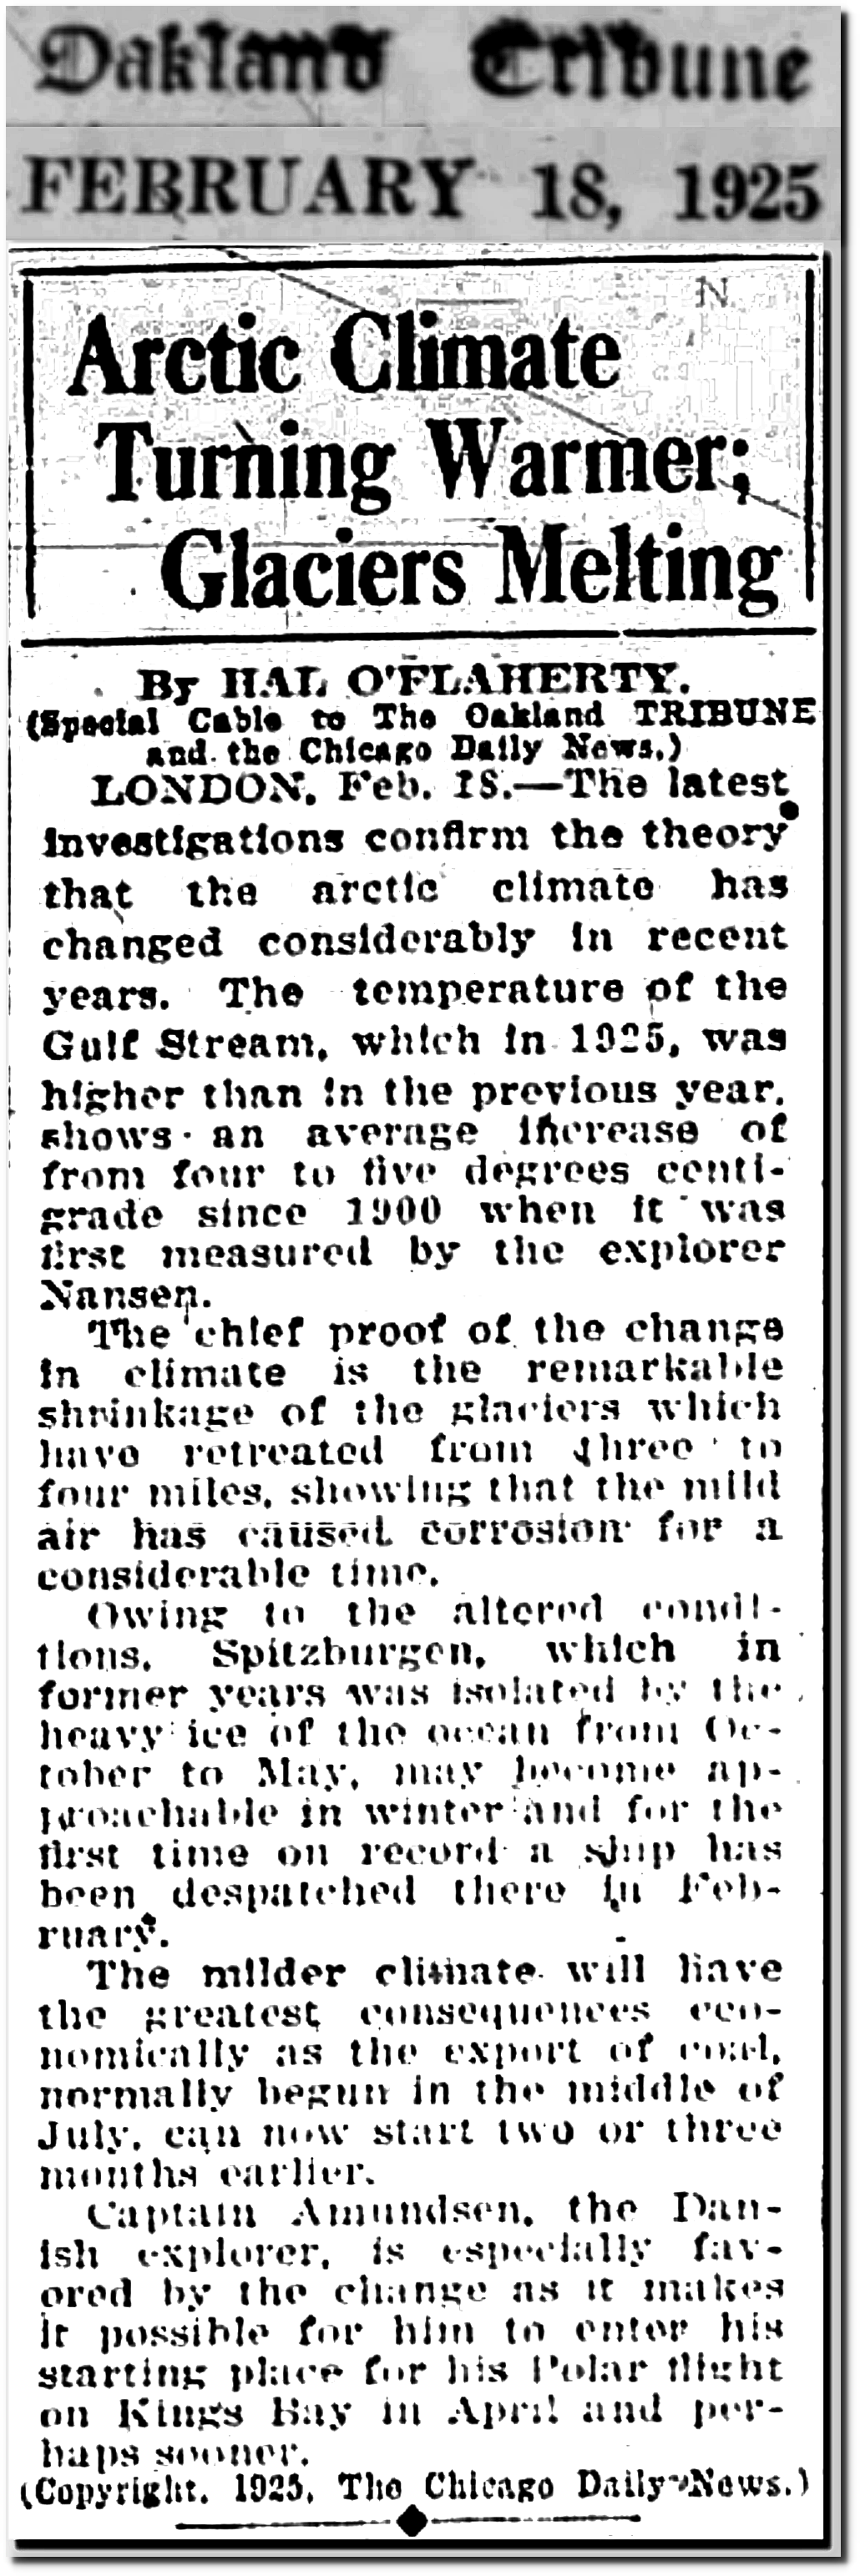
18 Feb 1925, Page 12 – Oakland Tribune at Newspapers.com
Historical evidence shows the 1930s were very warm in the eastern Arctic.
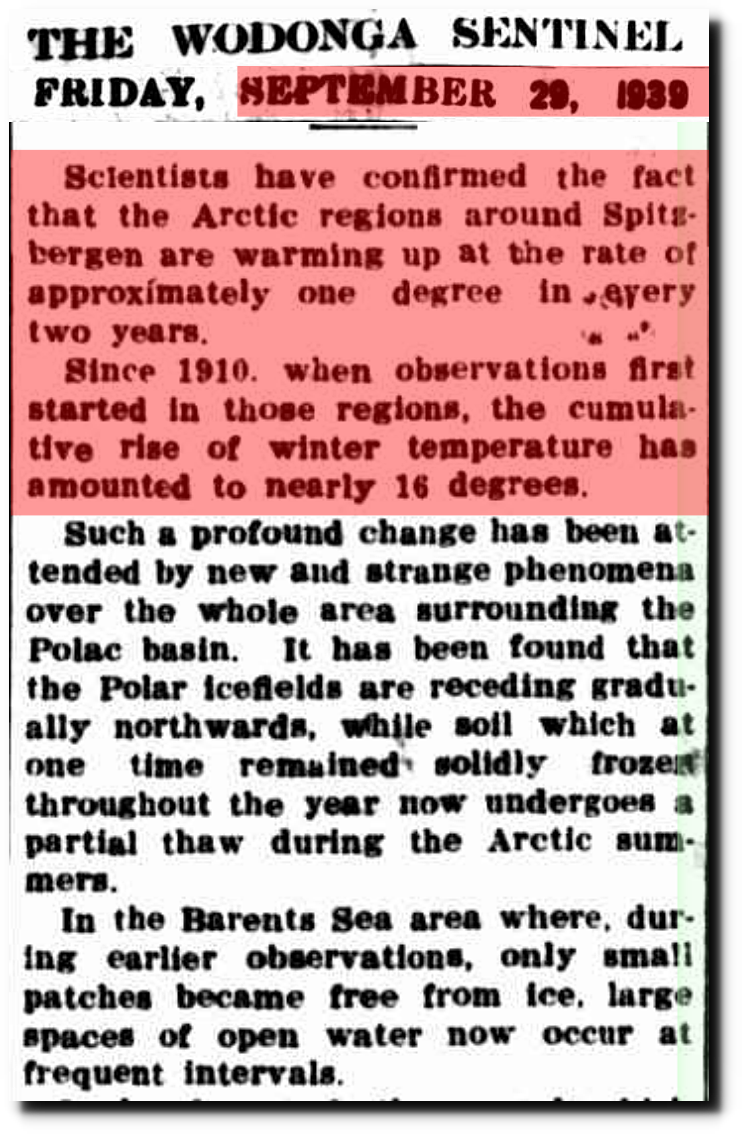
29 Sep 1939 – What is The World Coming To? – Trove

17 Dec 1939, Page 15 – Harrisburg Sunday Courier
“Since 1900, Dr. Ahlmann said, Arctic air temperatures have in-creased 10 degrees fahrenheit, an “enormous” rise from a scientific standpoint. …. if the Antarctic ice regions and the major Greenland ice cap should be reduced at the same rate as the present melting, oceanic surfaces would rise to catastrophic proportions …. Peoples living in lowlands along the shores would be inundated. …. we know that the tropics have felt a marked climatic change in the last fifteen or twenty years, especially in the vicinity of West Africa. Many smaller lakes have actually disappeared and larger ones are drying up. The Arctic change, the scientist asserted, “is so serious that I hope an international agency can be formed to study conditions on a global basis. That is most urgent.” One effect of the change, he said, has been to improve navigation conditions along the northern rim of Europe, a development of chief interest to Russia. “In 1910 the navigable season along western Spitsbergen lasted only three months,” he said. “Now it lasts eight months. This is of world strategic importance.”
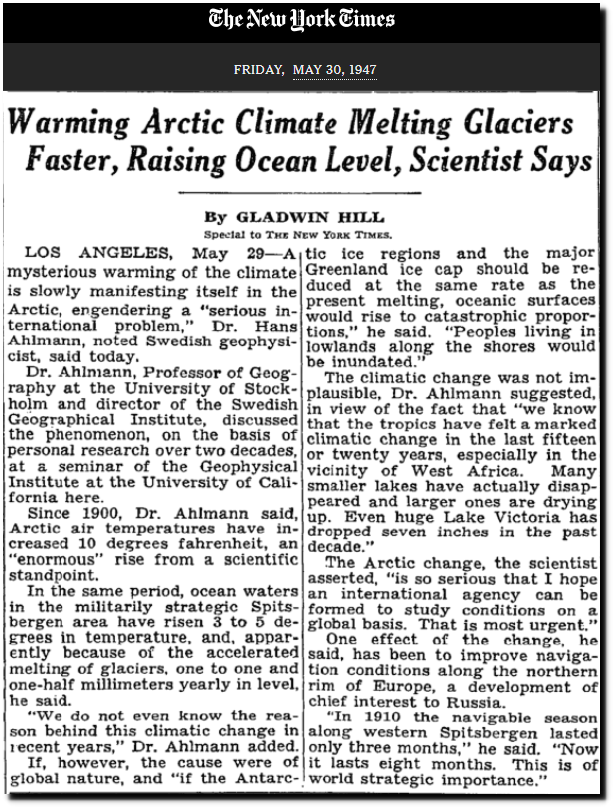
TimesMachine: May 30, 1947 – NYTimes.com
“Dr. E. Nilsson, of Stockholm University, visited Africa in 1947 and found that the water level in Lake Victoria had fallen seven feet in the last 10 years! In America, the Great Salt Lake in Utah has lost nearly 50 per cent, of its volume since 1850. Its salt content has doubled during that time.”
“All glaciers examined from Greenland through Scandinavia to Europe are shrinking. And the shrinkage is not limited to high latitudes. Some glaciers in the European Alps have vanished completely. In East Africa, the glaciers on three high volcanoes—Kilimanjaro, Mt. Kenya and Ruwenzori have been diminishing since they were first observed in 1880. The vast Muir Glacier in Alaska’s Glacier Bay has retreated a full 14 miles since 1902.
A young professor at the University of Wisconsin in the far north of the United States, Joseph Hickey, has been watching the birds of his State for the last ten years and he. too, is convinced that the climate is warming up.Comparing his observations with existing records, he says that many species of American birds and mammals have moved as much as 100 miles northward over the last 40 years. The Tit
mouse, the Turkey Vulture, the Whip-poor-will, the Swallow and
the Opossum have detected the ‘ change in the climate much more quickly than we have and have moved north to find their accustomed climatic environment.”

29 Sep 1951 – “HERALD” SATURDAY MAGAZINE Glaciers, Icebergs Melt As World Gets Warmer – Trove
“Dr. William S. Carlson, an Arctic expert, said last night that Polar icecaps were melting at an astonishing and unexplained rate and threatening to swamp seaports by raising ocean levels. …. The glaciers of Norway and Alaska are only half the size they were 50 years ago. The temperature around Spitzbergen has so modified that the sailing time has lengthened from three to eight, months of the year,”
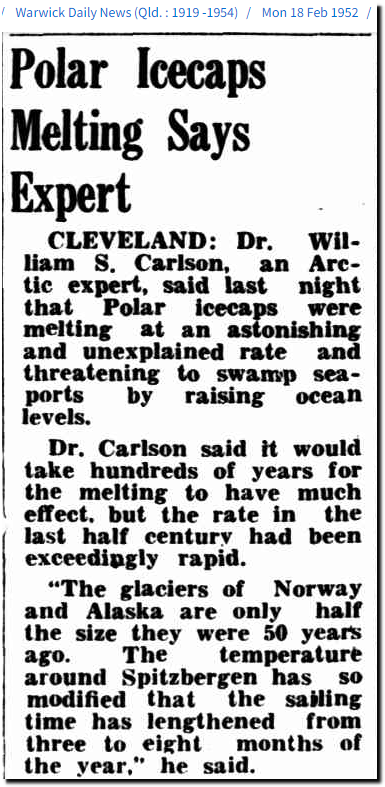
18 Feb 1952 – Polar Icecaps Melting Says Expert – Trove
“Greenland’s polar cli-mate has moderated so consist-ntly that communities of hunters have evolved into fishing villages. Sea mammals, vanishing from the west coast, have been replaced by codfish and other fish species in the area’s southern Waters. The tendency of the temperature of both the air and the sea to rise, the report states, has produced the dominant structural change of the economy of Green-land and in the lives and occupations of its people, that has characterized especially the last two decades.”
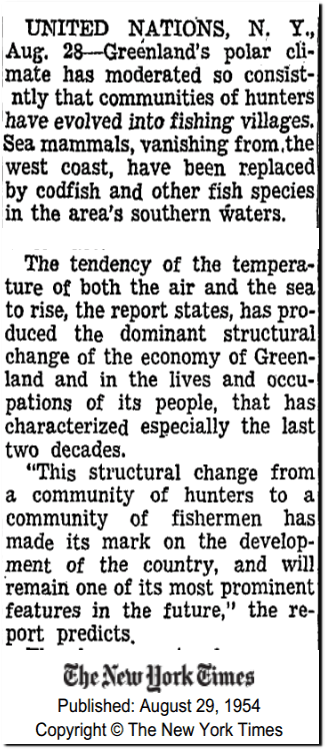
TimesMachine: Sunday August 29, 1954 – NYTimes.com
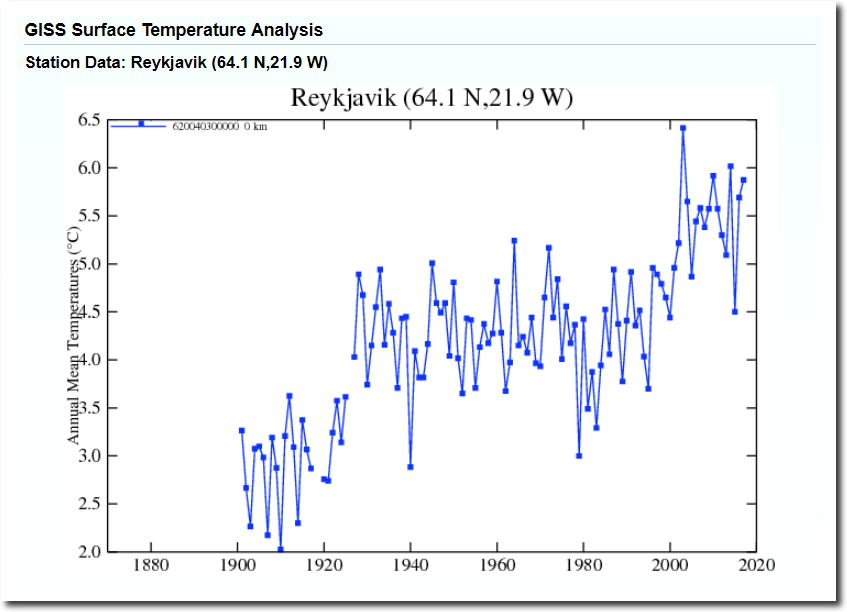
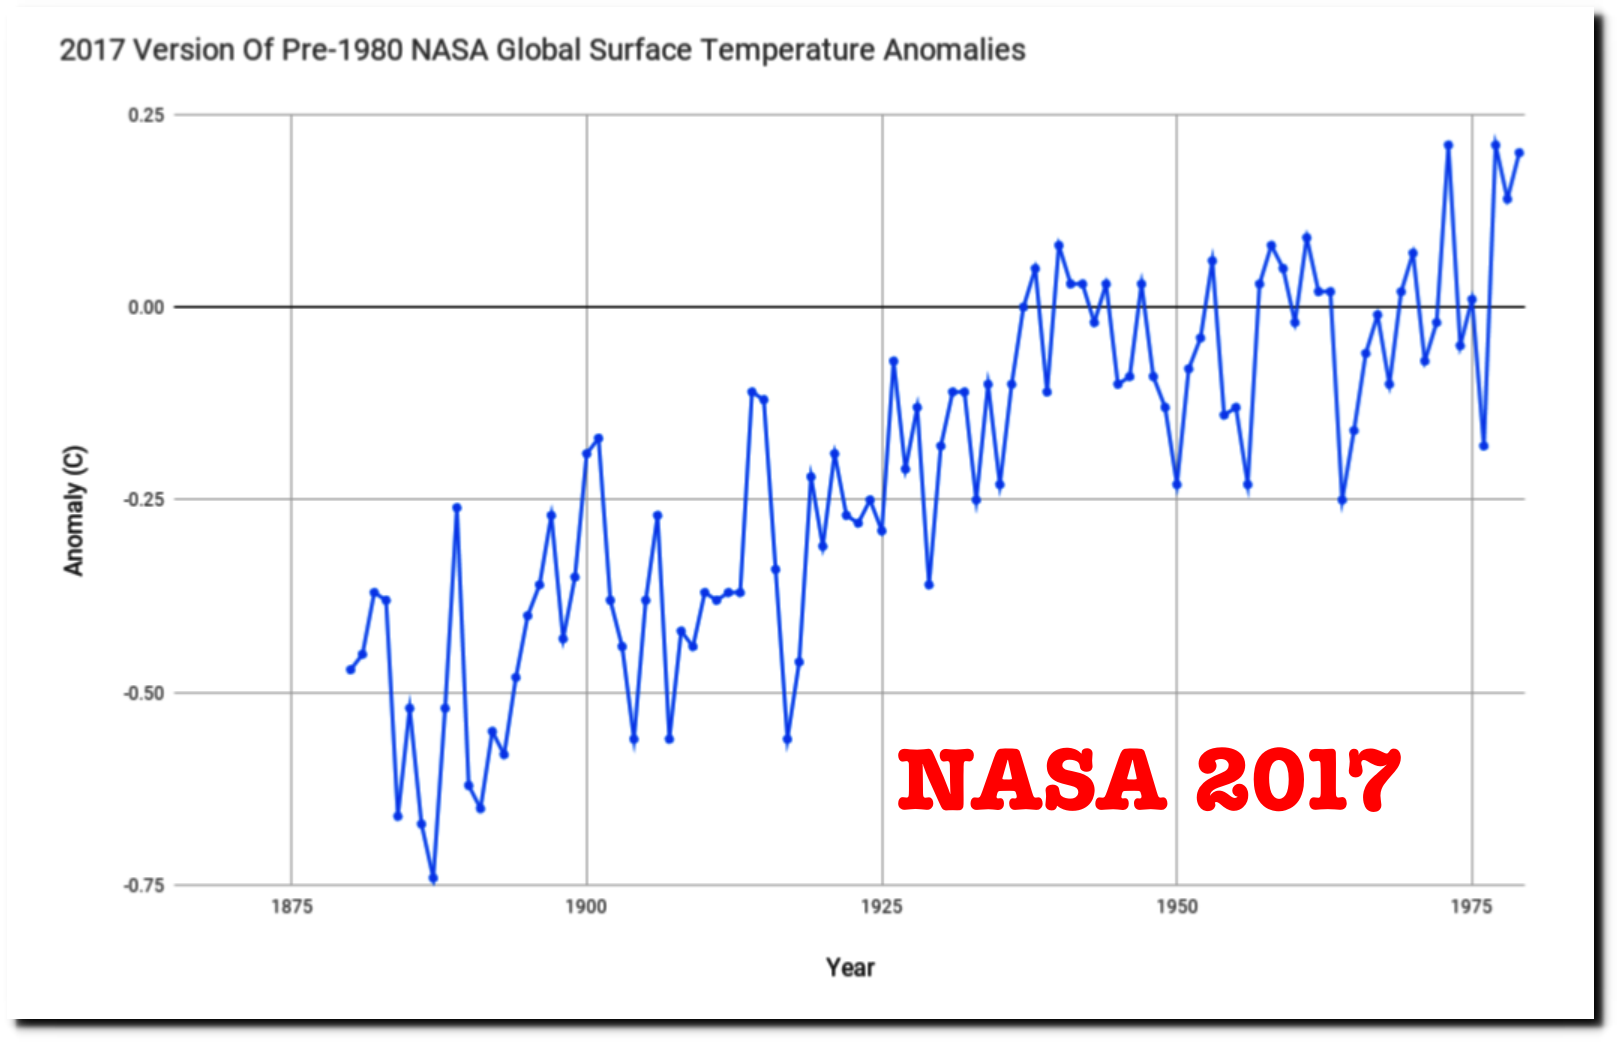
NASA altered the data to make that warmth disappear.
This is one of many alterations NASA has made to that graph over the past decade.
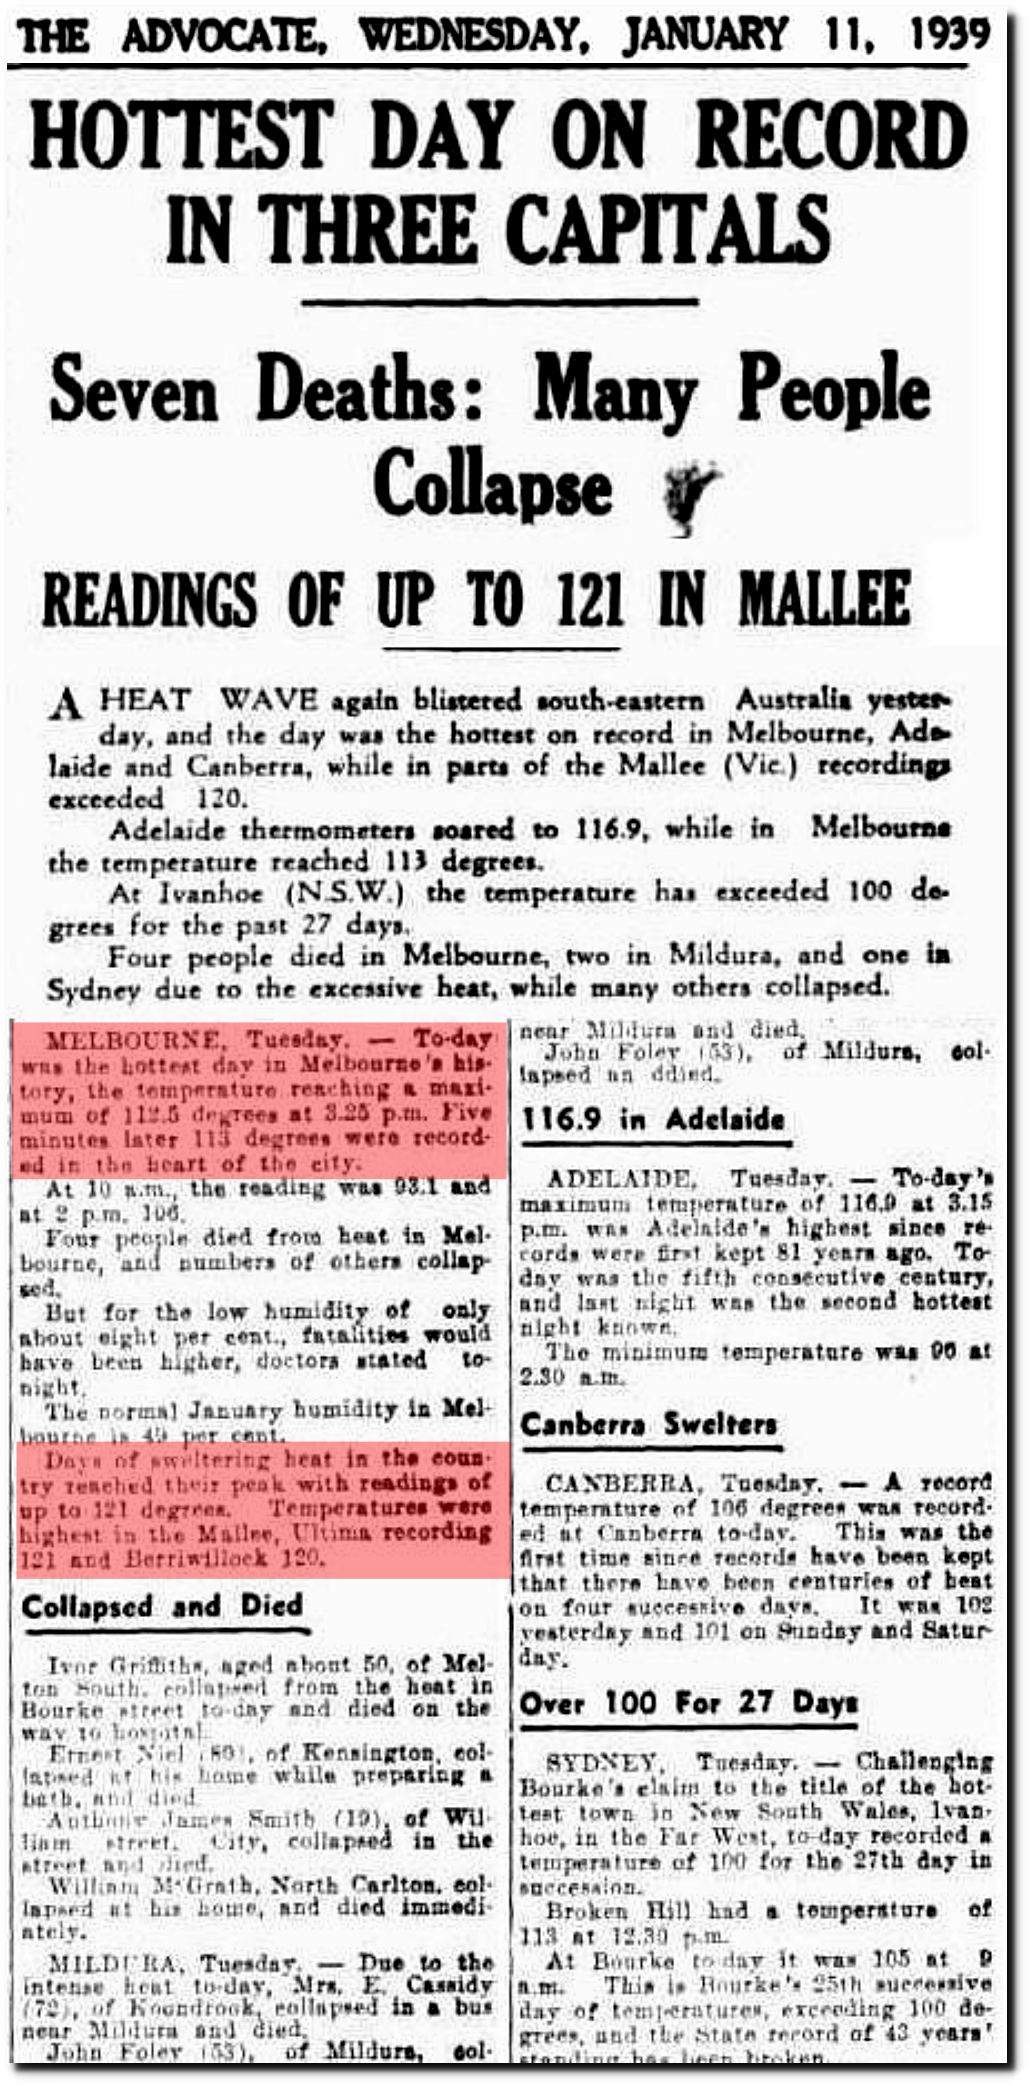
11 Jan 1939 – HOTTEST DAY ON RECORD IN THREE CAPITALS Seven Deaths: Many People Collapse – Trove

12 Feb 1940 – A Hot Spot – Trove
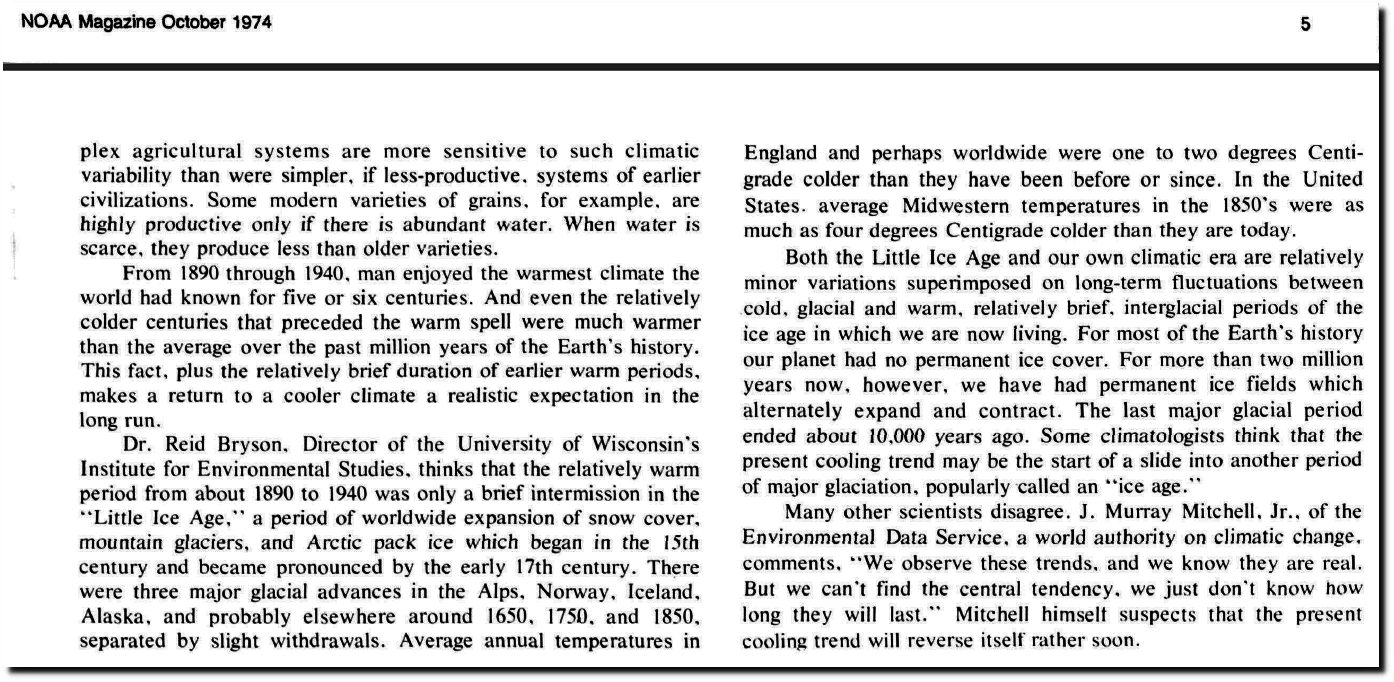
In 1974, NOAA said the period from 1890 to 1940 was very warm.
“From 1890 through 1940. man enjoyed the warmest climate the world had known for five or six centuries. And even the relatively colder centuries that preceded the warm spell were much warmer than the average over the past million years of the Earth’s history.”
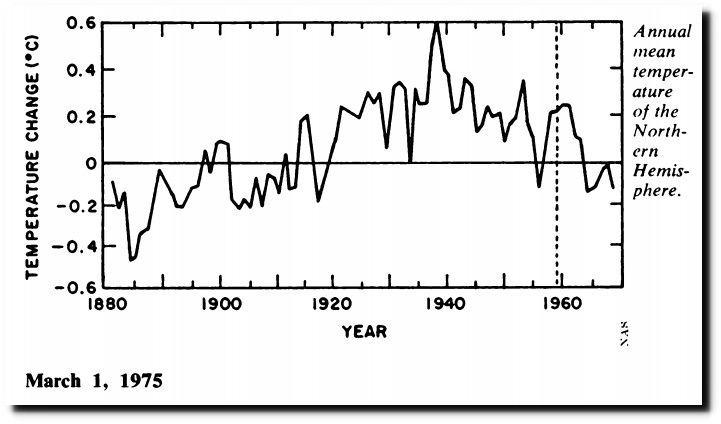
This graph was published by the National Academy of Sciences in 1975, showing 0.5C cooling in the Northern Hemisphere after the 1940s.
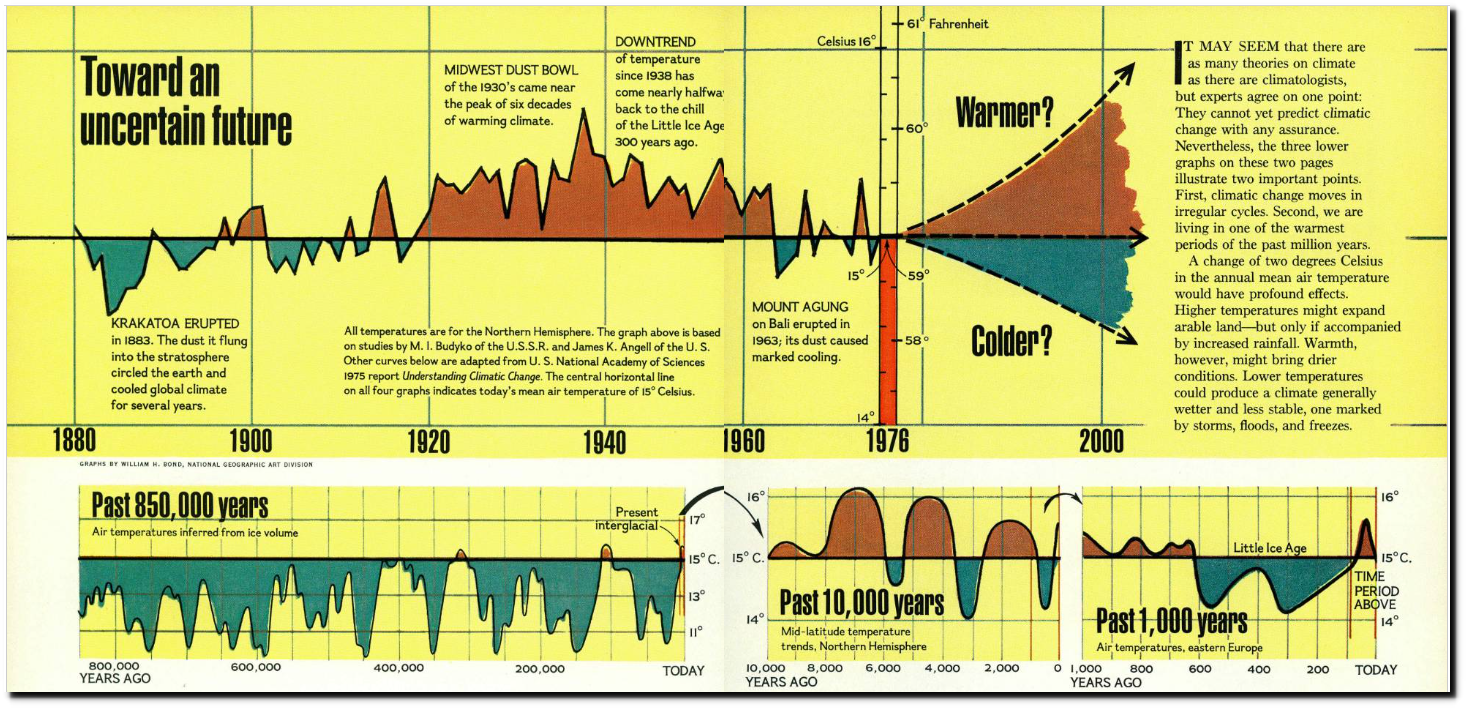
National Geographic Magazine Archive
In 1974, NCAR showed the 1930s as being very warm.
14 Jul 1974, Page 1 – Lincoln Evening Journal
NASA has erased that warmth.
Twenty years ago, NASA’s James Hansen was upset that the US was cooling – even as CO2 increased.
How can the absence of clear climate change in the United States be reconciled with continued reports of record global temperature?
in the U.S. there has been little temperature change in the past 50 years, the time of rapidly increasing greenhouse gases — in fact, there was a slight cooling throughout much of the country
 NASA GISS: Science Briefs: Whither U.S. Climate?
According to NOAA, the vast majority of high quality long term daily temperature data is from the US, and in fact there is little or no high quality data over most of the Earth.
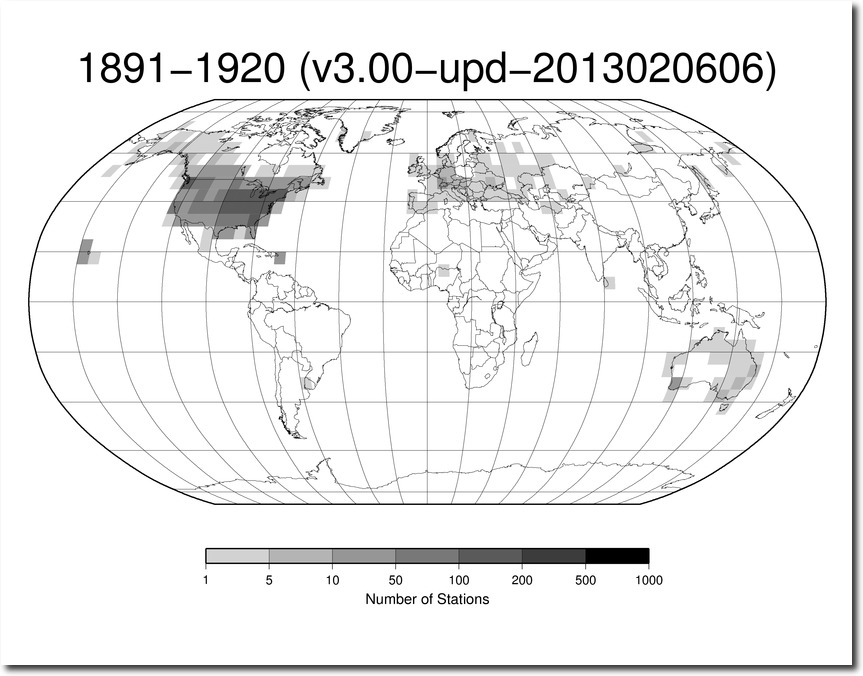
Index of /pub/data/ghcn/daily/figures/
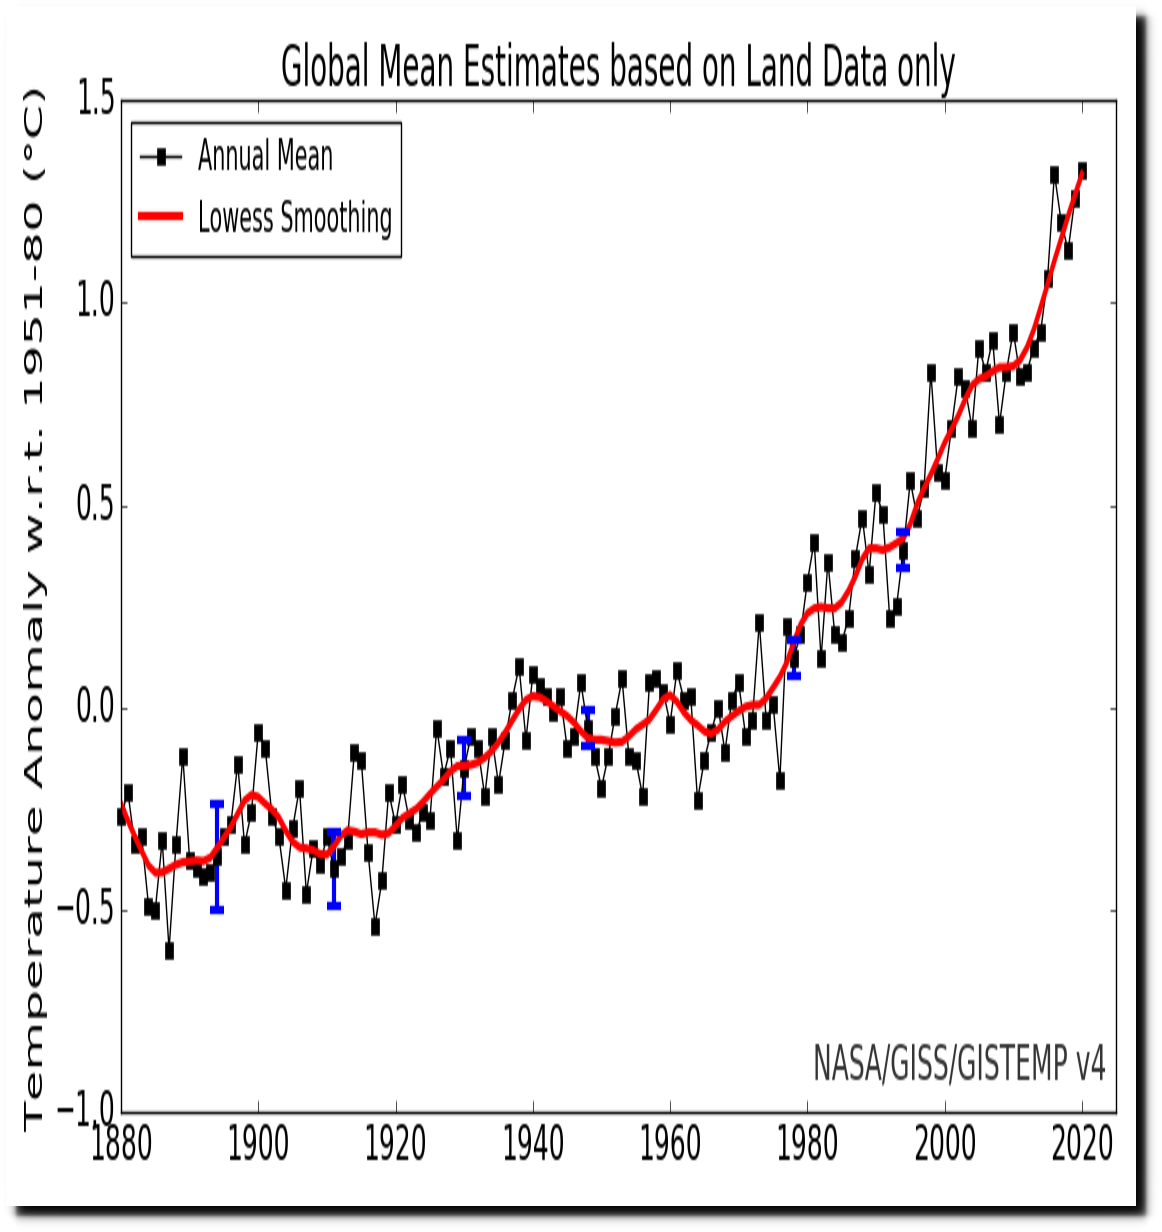
NASA has since altered the data to make the warmth of the 1930s disappear.
In 2001, NASA showed about 0.5C global warming from 1880 to 2000.
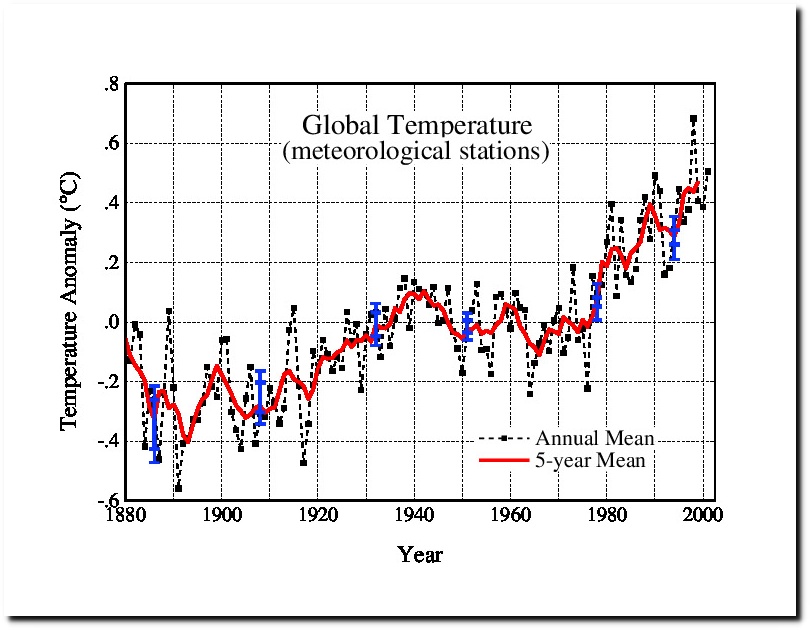
2001 Version from this referring page
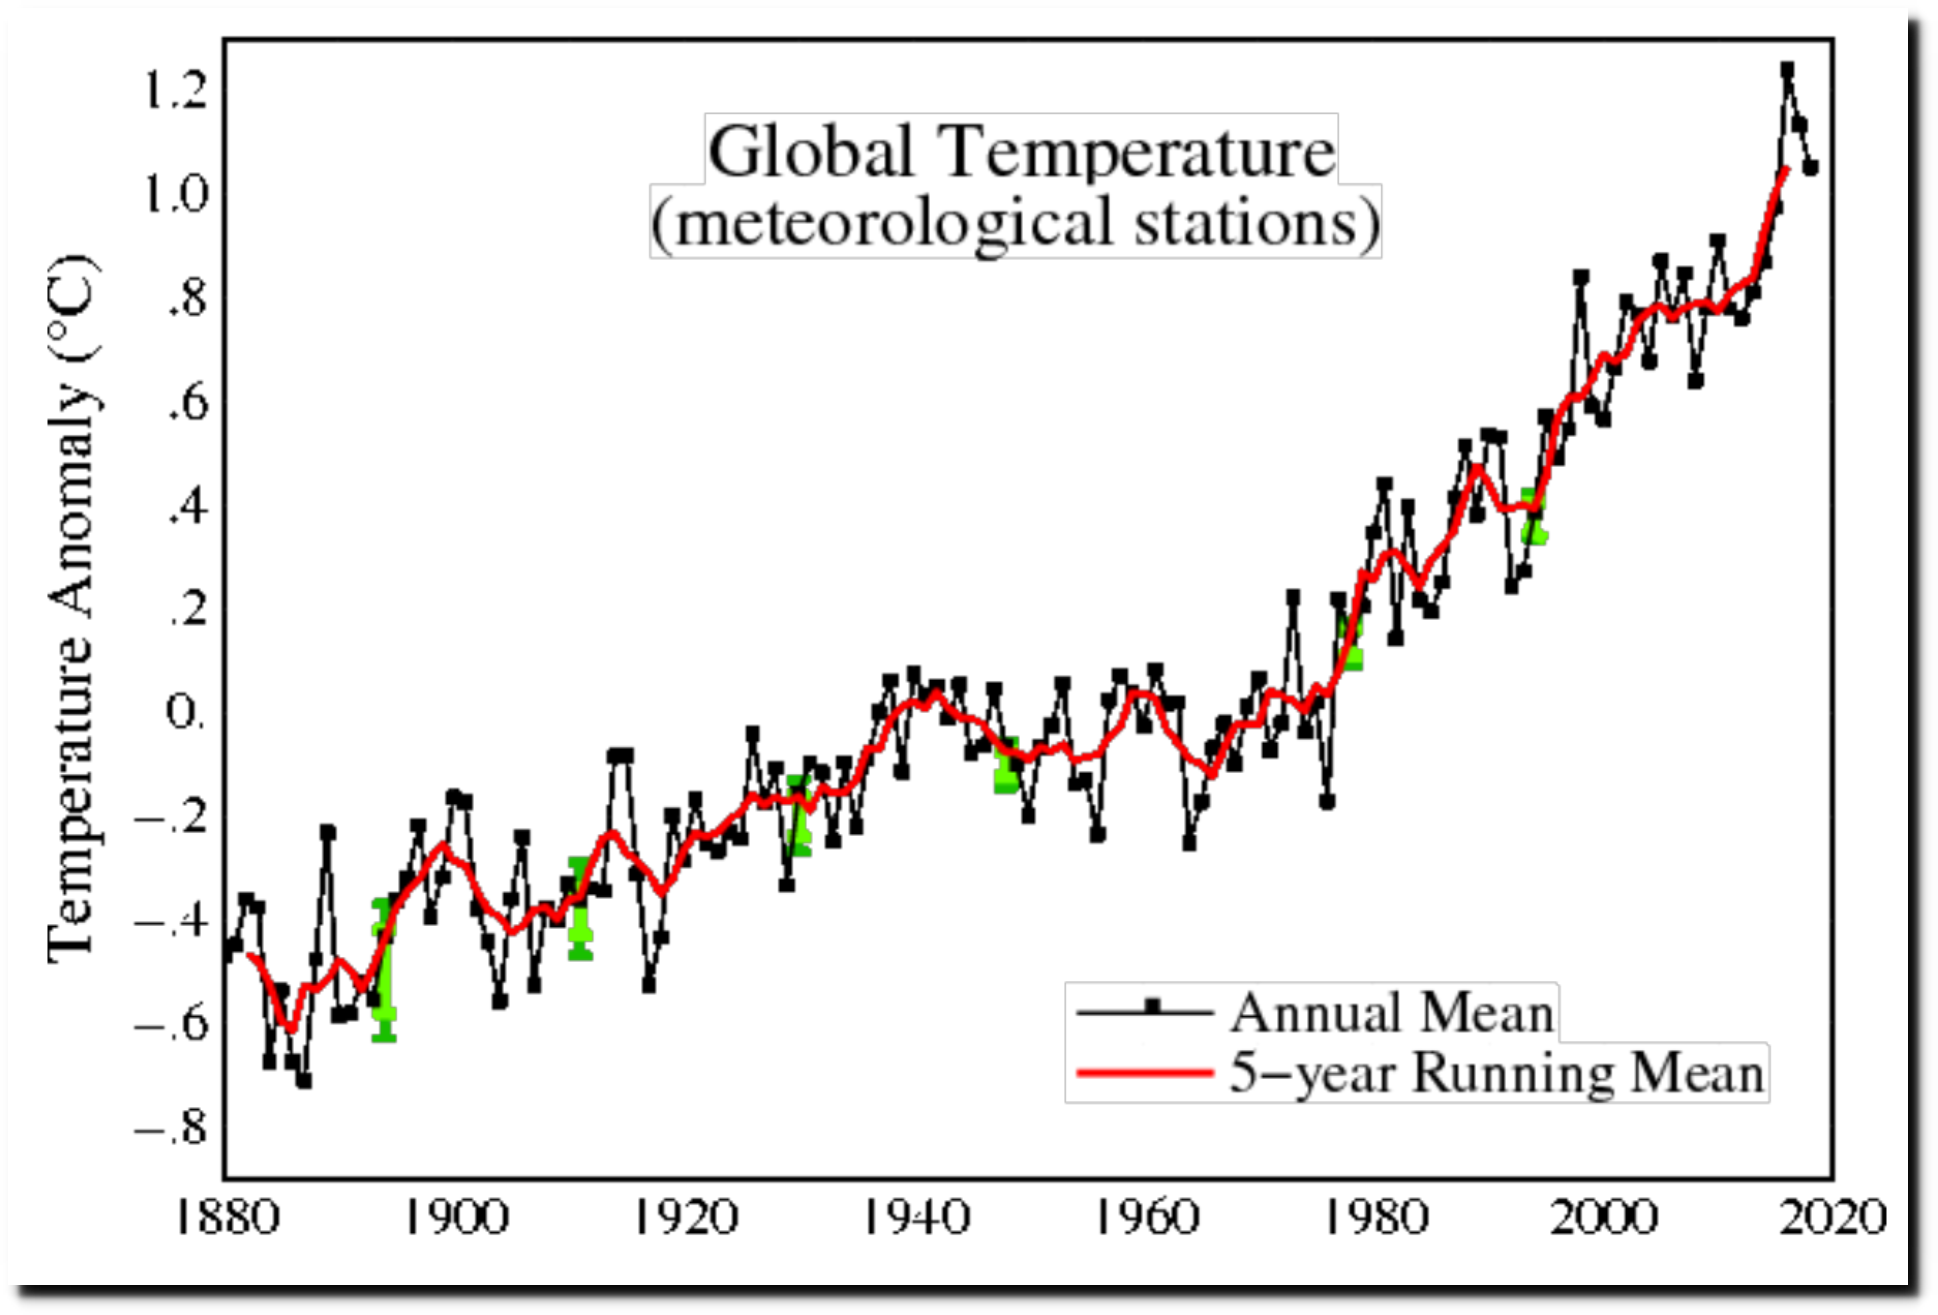
By 2019, they had doubled 1880-2000 warming.
As of the year 2000, NASA showed no net global warming from 1870 to 1979, with 1878 being the warmest year.
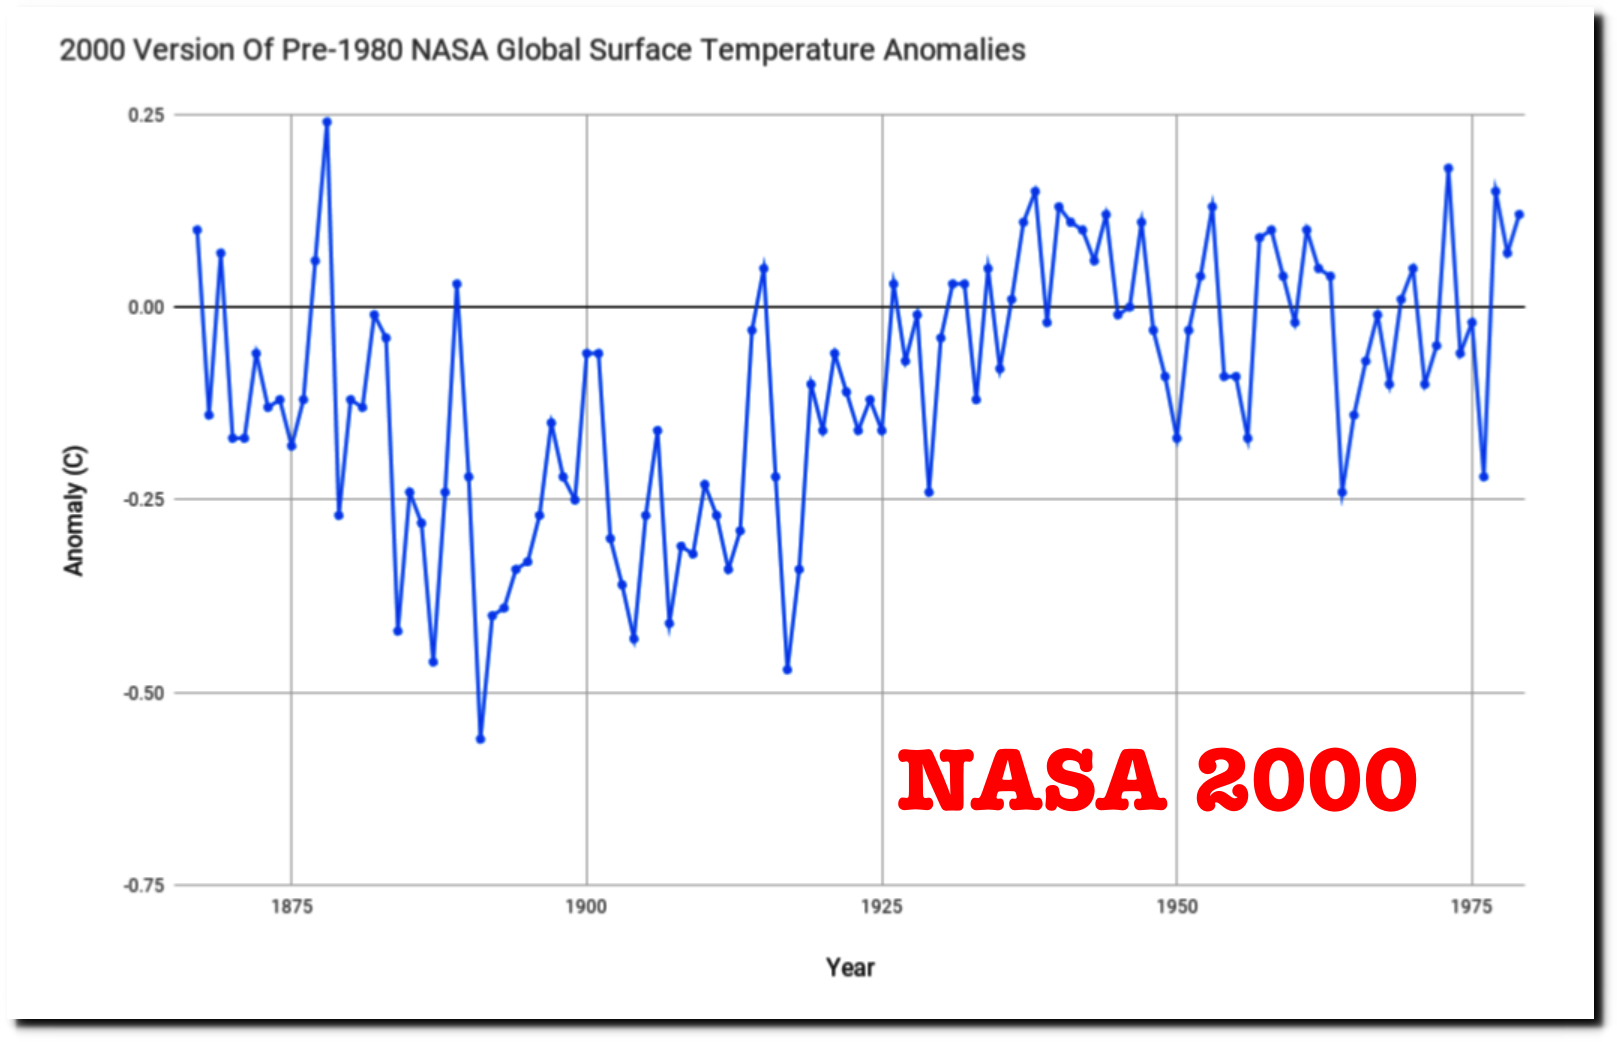
But they now hide data before 1880, and show about 0.7C warming prior to 1980
https://data.giss.nasa.gov/gistemp/history/output/met_used.zip
This animation shows how they have altered the data
There was no winter in Minnesota in 1878.
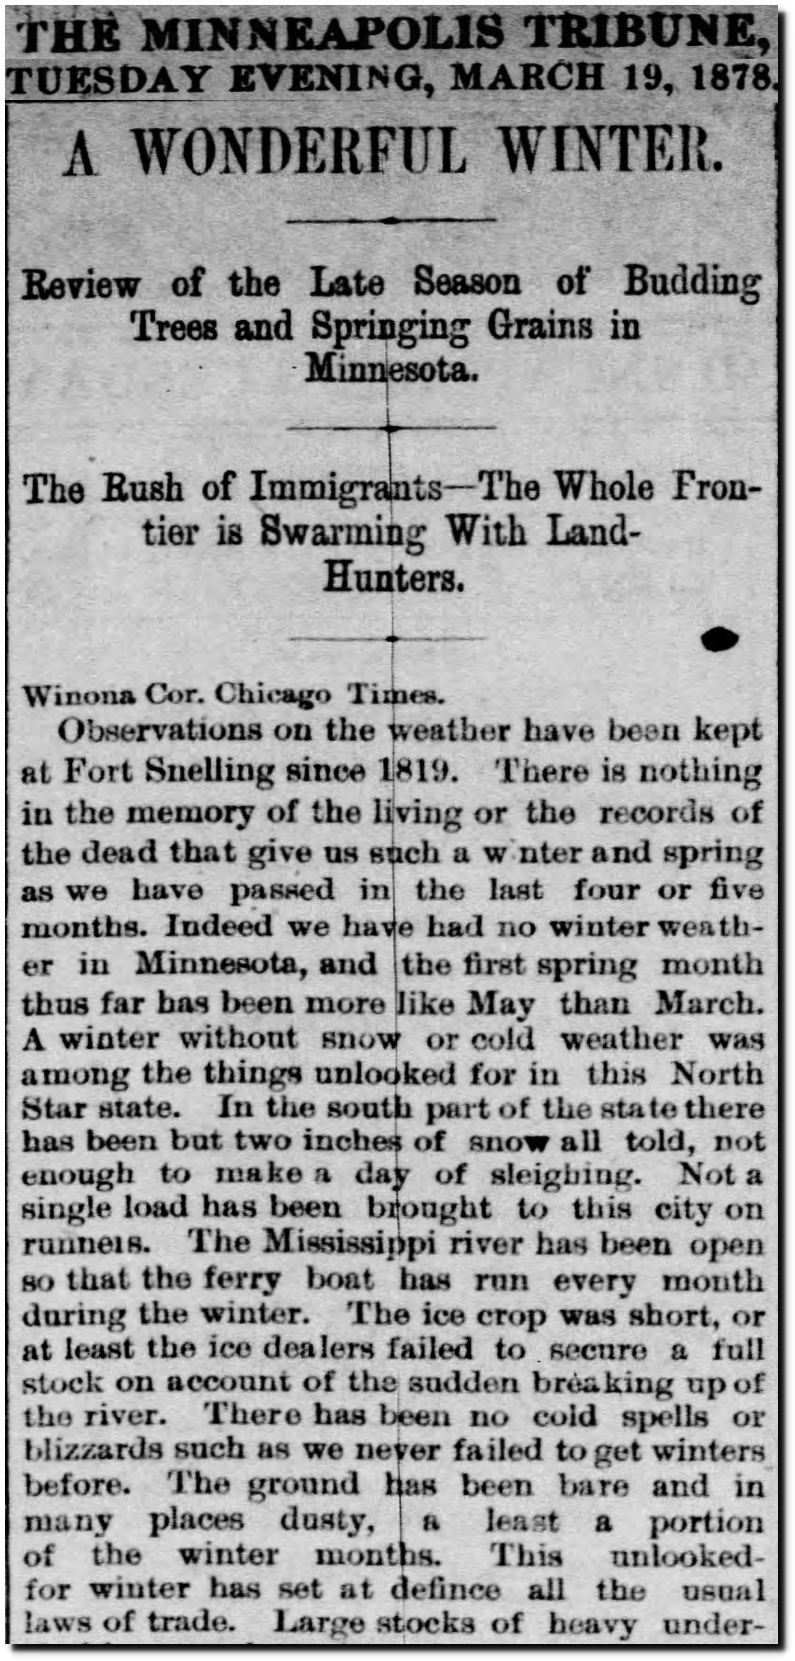
19 Mar 1878, Page 2 – Star Tribune at Newspapers.com
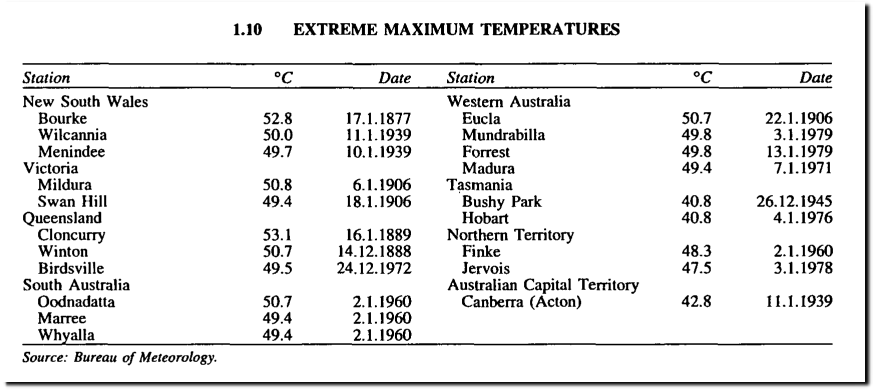
Australia had record heat.
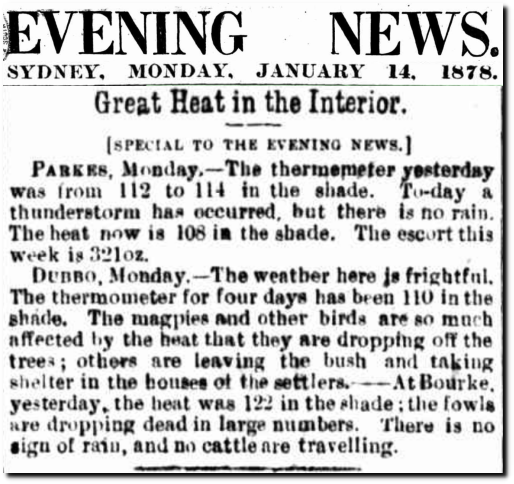
14 Jan 1878 – Great Heat in the Interior. – Trove
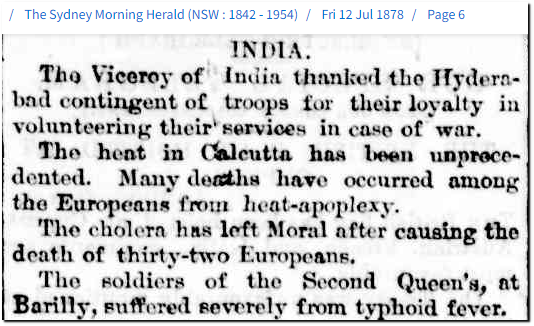
China had a famine which killed nearly ten million people.
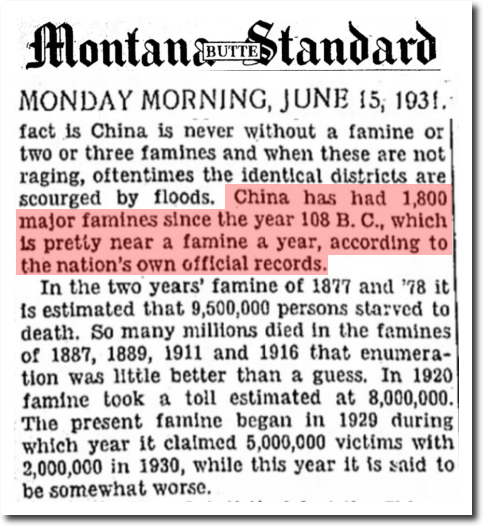
15 Jun 1931, Page 6 – Montana Butte Standard at Newspapers.com
And there was universal drought.
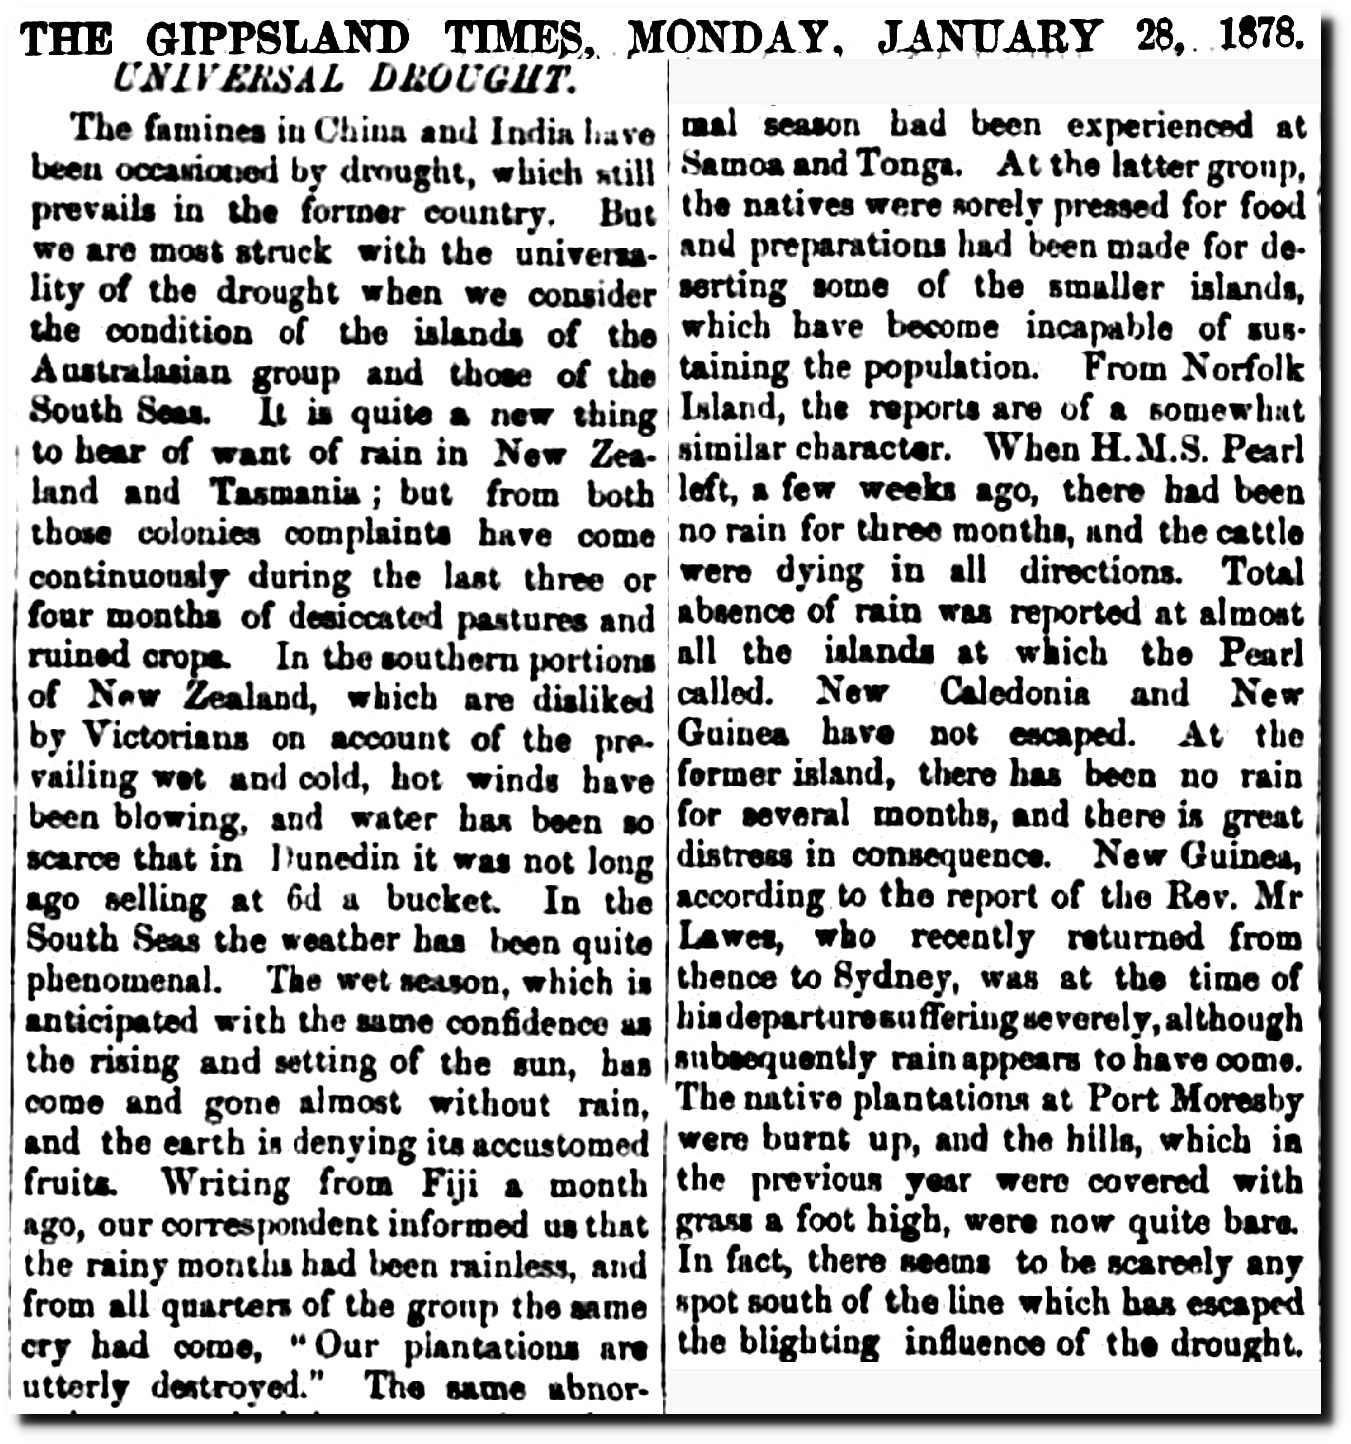
28 Jan 1878 – UNIVERSAL DROUGHT. – Trove

29 Jan 1878, Page 7 – The Sydney Morning Herald at Newspapers.com

31 Jan 1878, Page 7 – The Sydney Morning Herald at Newspapers.com
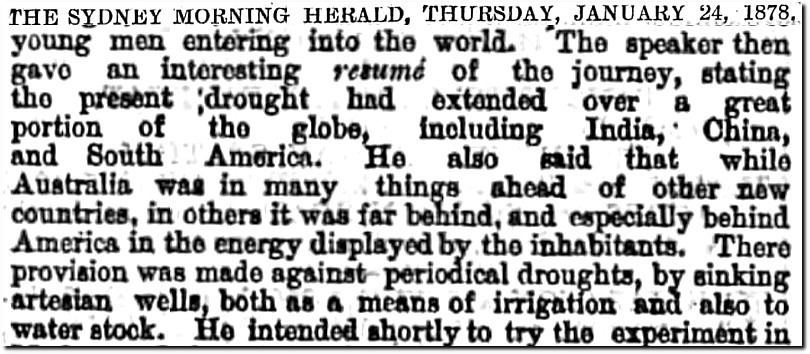
24 Jan 1878, Page 7 – The Sydney Morning Herald at Newspapers.com
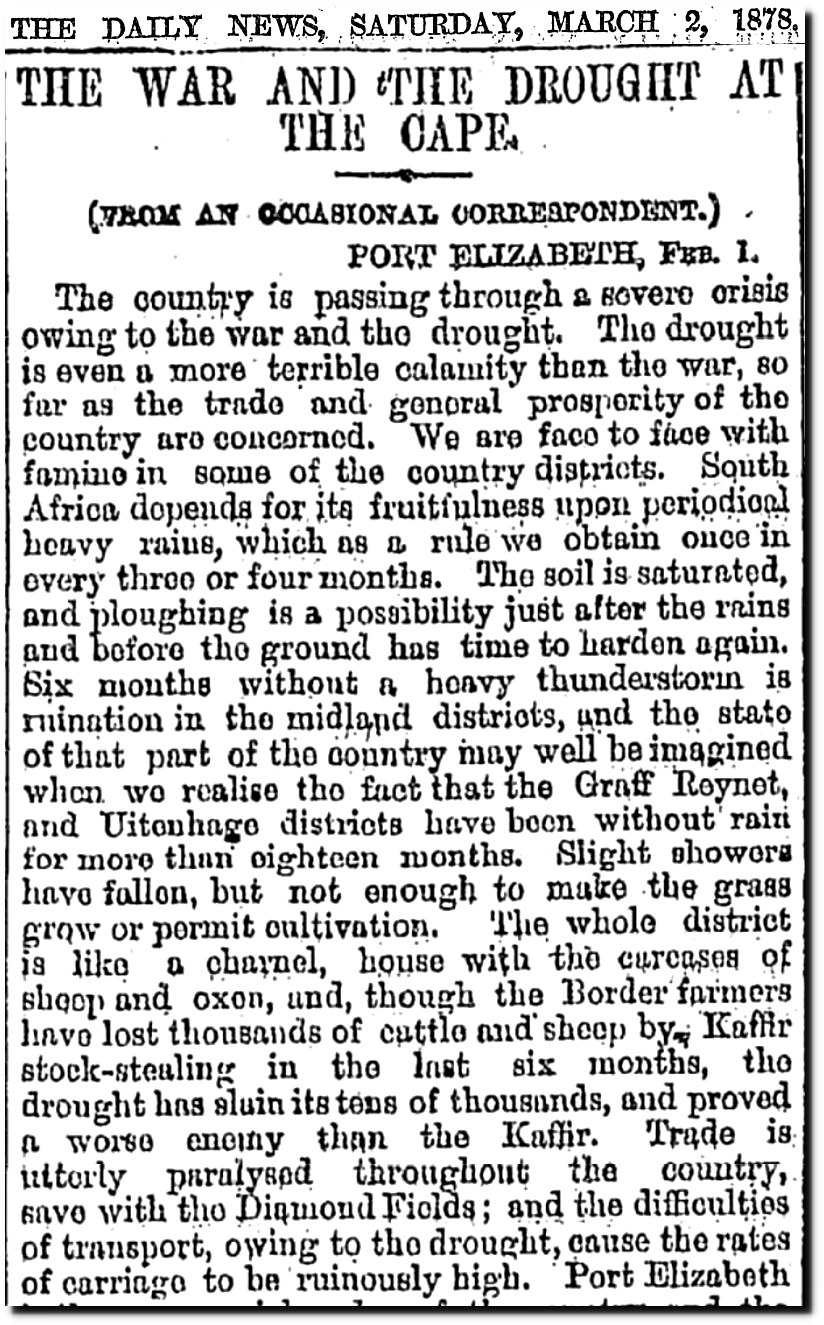
02 Mar 1878, 6 – Daily News at Newspapers.com
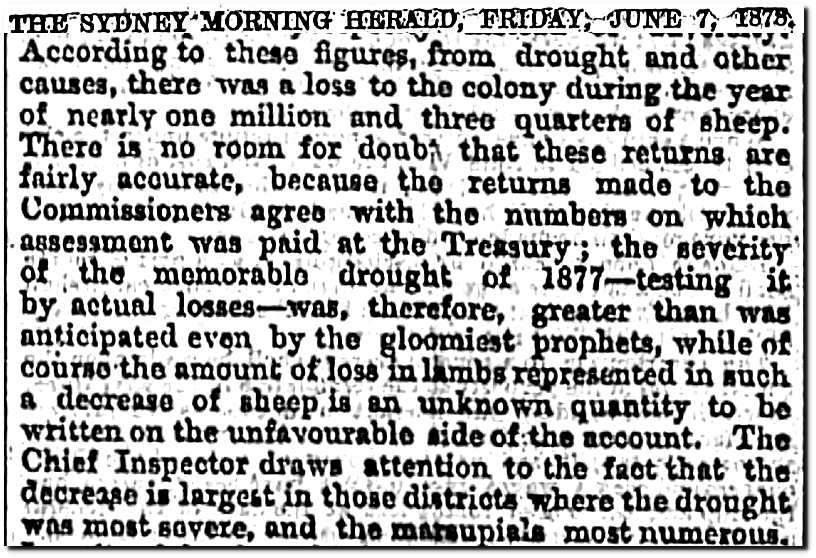
07 Jun 1878, Page 7 – The Sydney Morning Herald at Newspapers.com
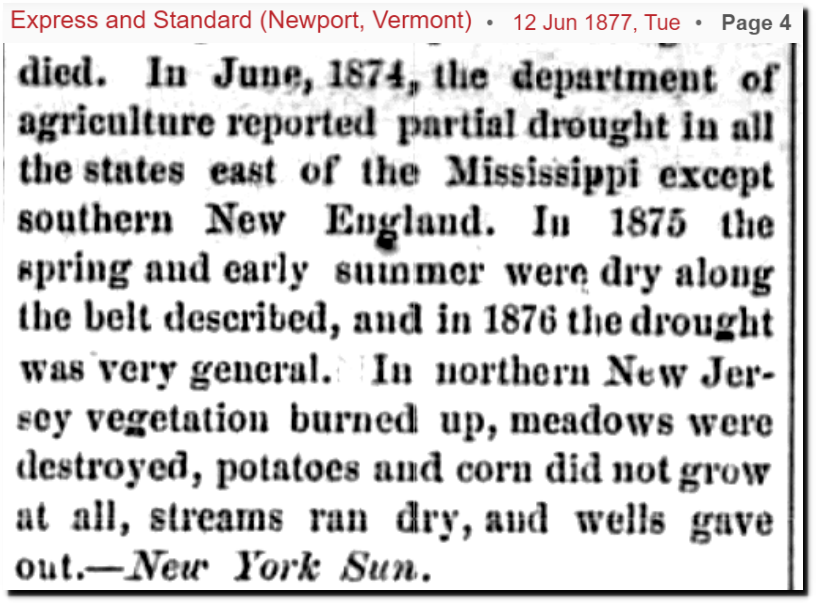
12 Jun 1877, 4 – Express and Standard at Newspapers.com
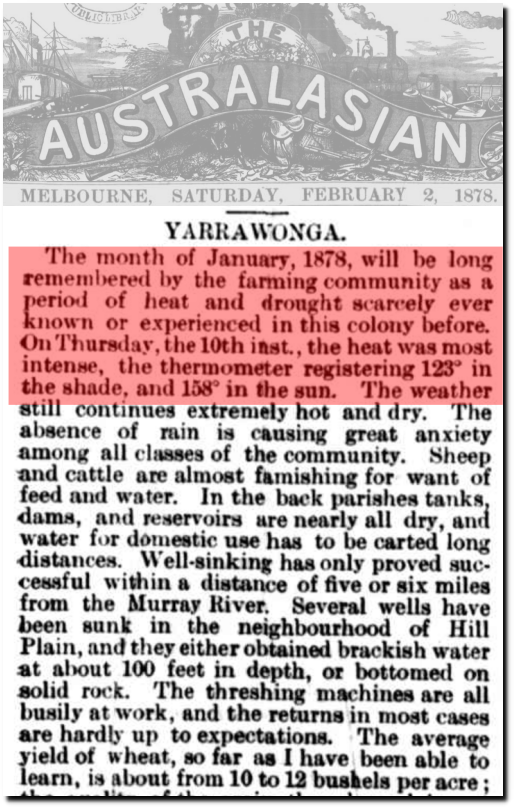
02 Feb 1878 – YARRAWONGA. – Trove
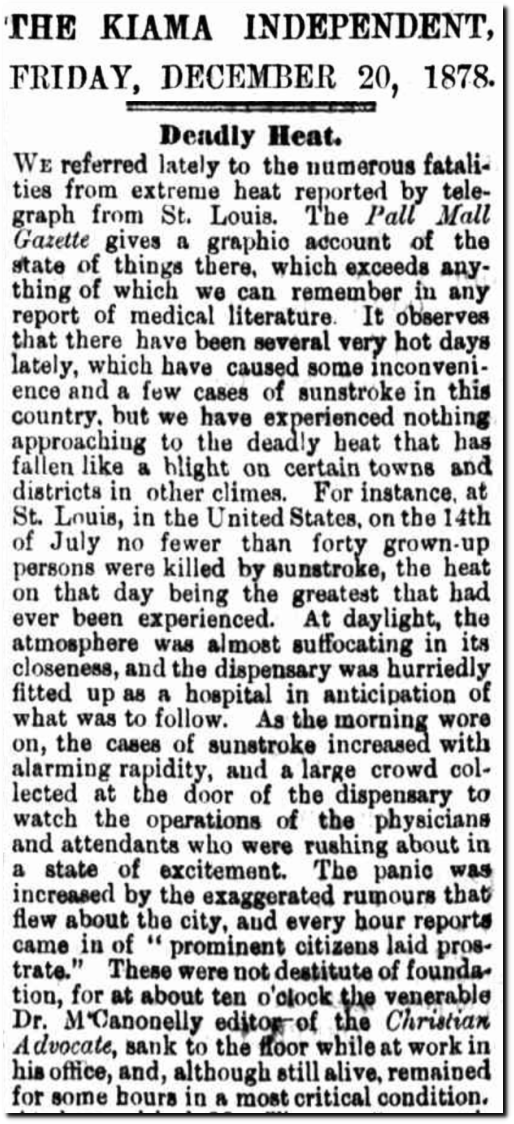
20 Dec 1878 – Deadly Heat. – Trove
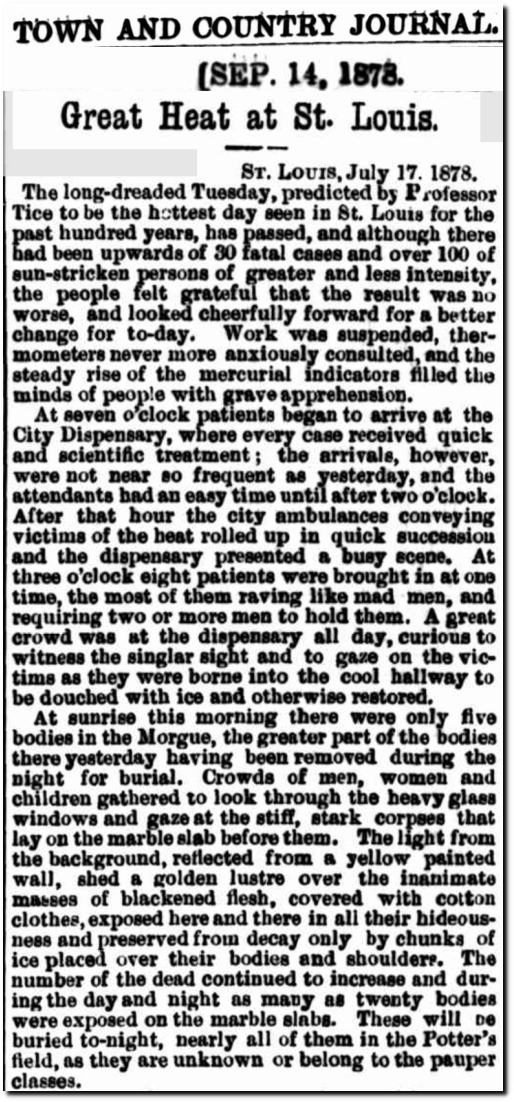
14 Sep 1878 – Great Heat at St. Louis. – Trove

23 Feb 1878 – BRISBANE. – Trove
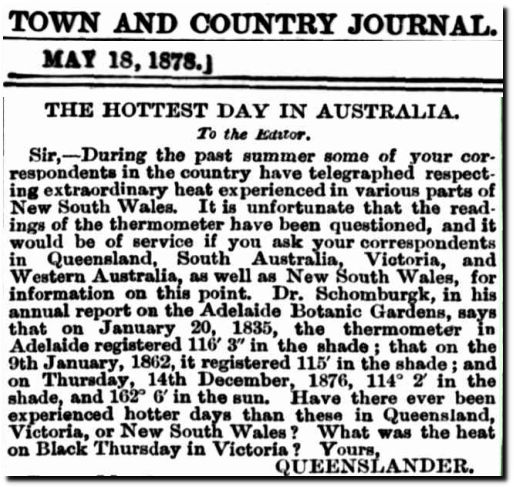
18 May 1878 – THE HOTTEST DAY IN AUSTRALIA. – Trove
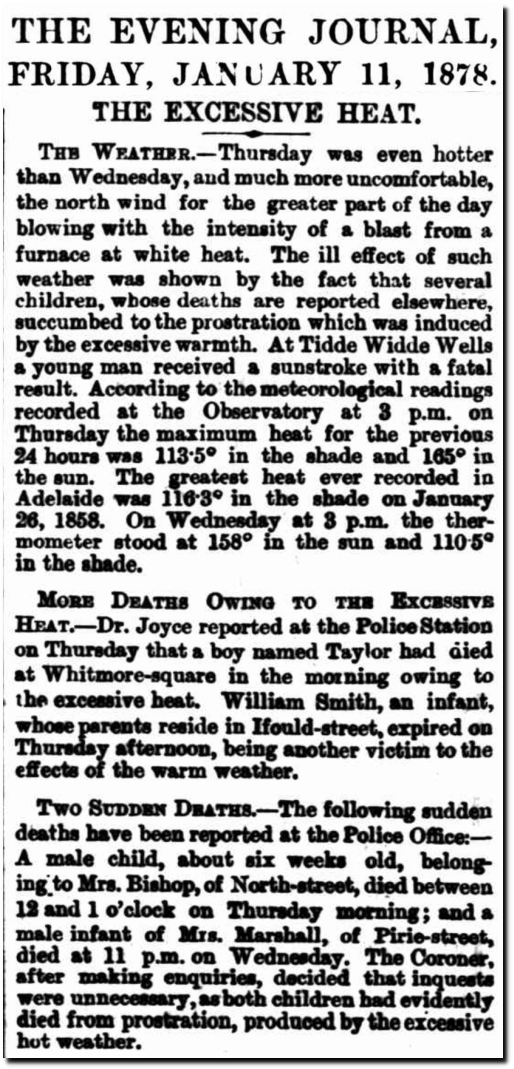
11 Jan 1878 – THE EXCESSIVE HEAT. – Trove
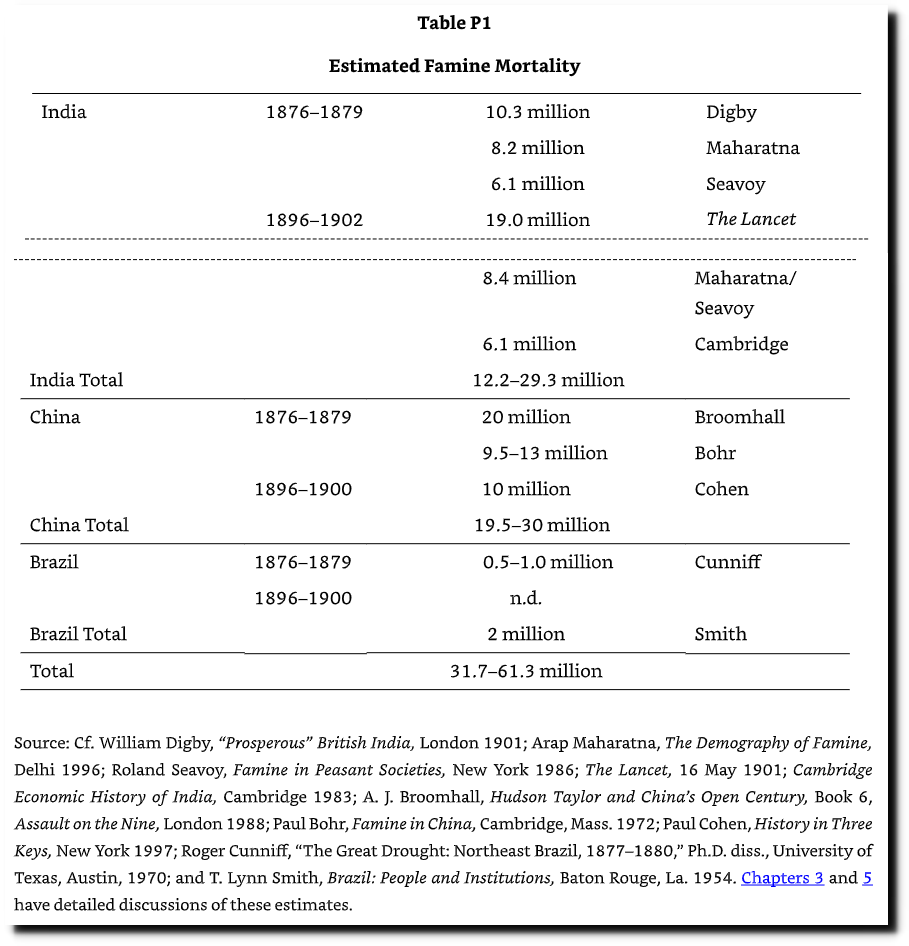
The worldwide drought and record heat of 1876-1878 killed fifty million people.
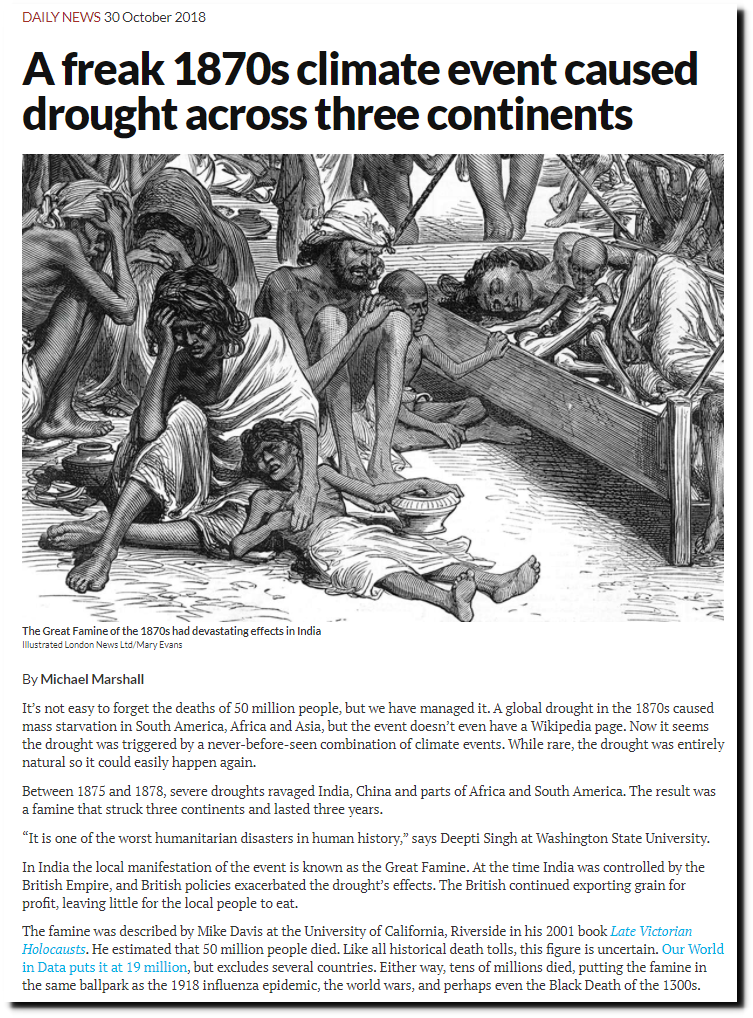
A freak 1870s climate event caused drought across three continents | New Scientist

SNAFU!: The Southern India famine of 1876–78


North China famine, 1876-79 | DisasterHistory.org
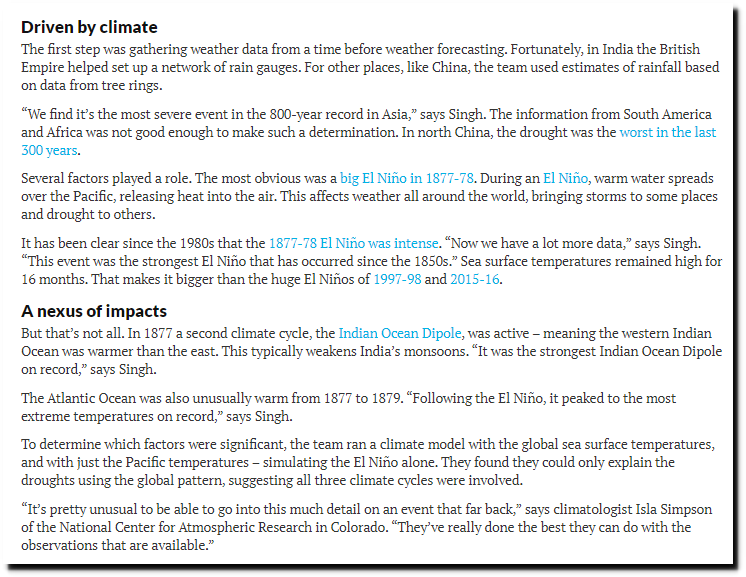
It has been clear since the 1980s that the 1877-78 El Niño was intense. “Now we have a lot more data,” says Singh. “This event was the strongest El Niño that has occurred since the 1850s.” Sea surface temperatures remained high for 16 months. That makes it bigger than the huge El Niños of 1997-98 and 2015-16. A nexus of impacts But that’s not all. In 1877 a second climate cycle, the Indian Ocean Dipole, was active – meaning the western Indian Ocean was warmer than the east. This typically weakens India’s monsoons. “It was the strongest Indian Ocean Dipole on record,” says Singh. The Atlantic Ocean was also unusually warm from 1877 to 1879. “Following the El Niño, it peaked to the most extreme temperatures on record,” says Singh.
A freak 1870s climate event caused drought across three continents | New Scientist
This came at the peak of the Atlantic Multidecadal Oscillation.
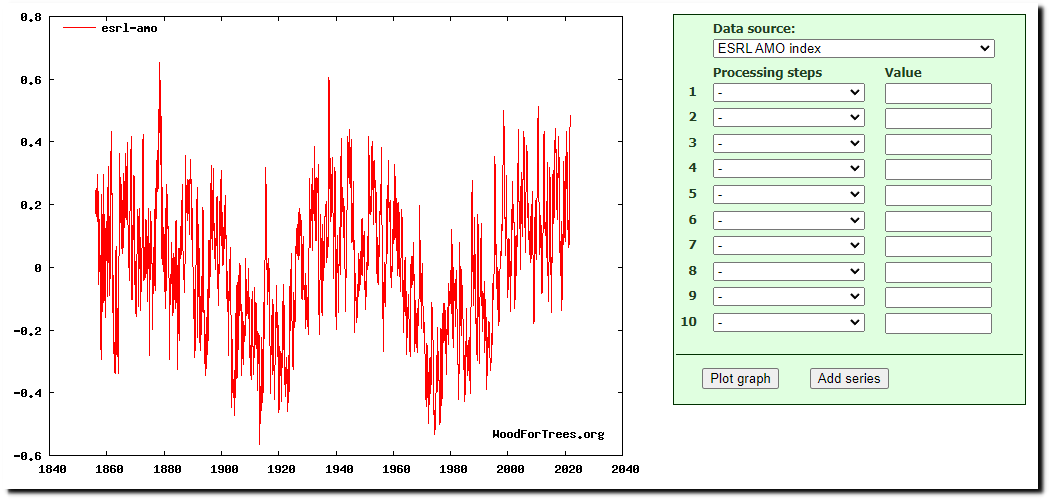
Wood for Trees: Interactive Graphs
New South Wales’ all-time record temperature of 127F occurred on January 17, 1877.
Data.GISS: GISS Surface Temperature Analysis (GISTEMP v4)
There was collusion to remove the warmth of the 1940s.
“if we could reduce the ocean blip by, say, 0.15 degC,
then this would be significant for the global mean — but
we’d still have to explain the land blip.It would be good to remove at least part of the 1940s blip,
but we are still left with “why the blip”

Climate scientists openly admit they are altering observed data to match their models.

John Abraham’s “science and truth” was actually appeals to authority from people with no credibility.
