
The Biden administration uses this graph as evidence that burning fossil fuels is making the weather more severe.
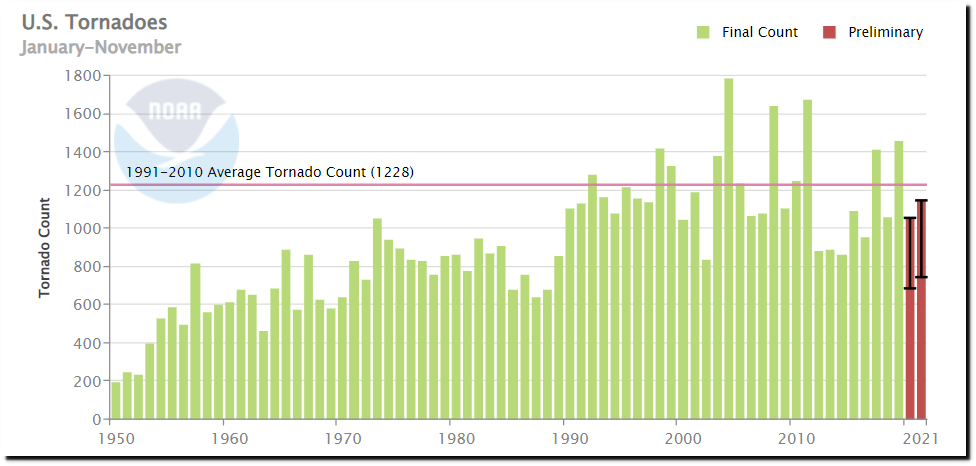
U.S. Tornadoes | Societal Impacts | National Centers for Environmental Information (NCEI)
But NOAA knows the graph is flawed due to changes in the way tornadoes are detected and recorded. NOAA adjusts the tornado count for inflation – which makes the apparent increase disappear.

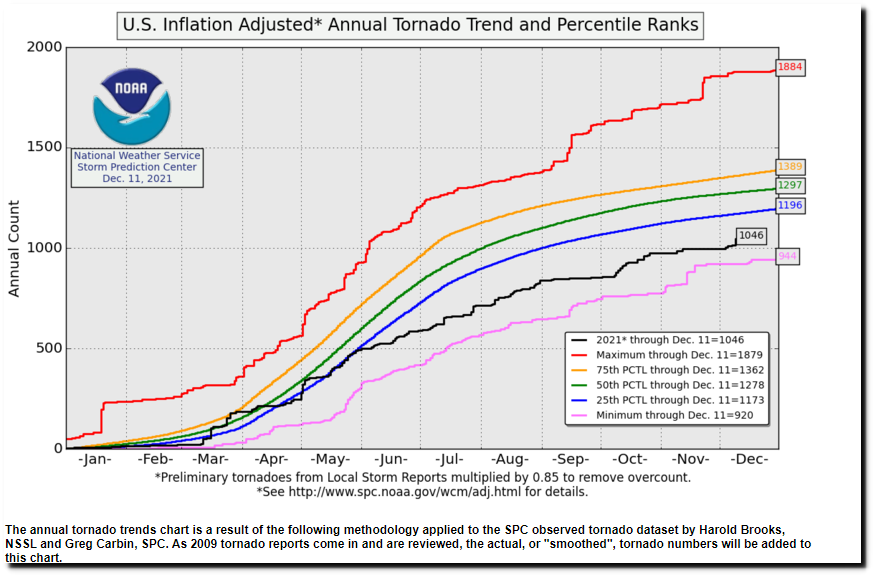
Inflation Adjusted Tornado Running Totals – Storm Prediction Center WCM Page
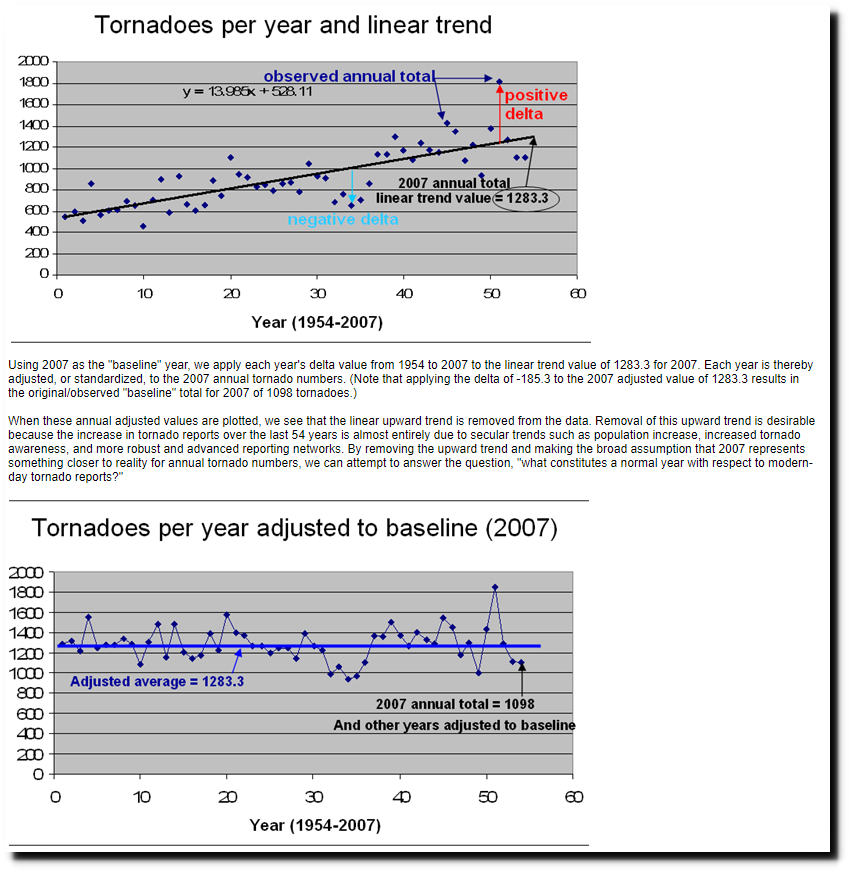
That NOAA web page has a link to an explanation explaining what is wrong with the data. That web page has been deleted by NOAA, but is available on the Internet Archive.
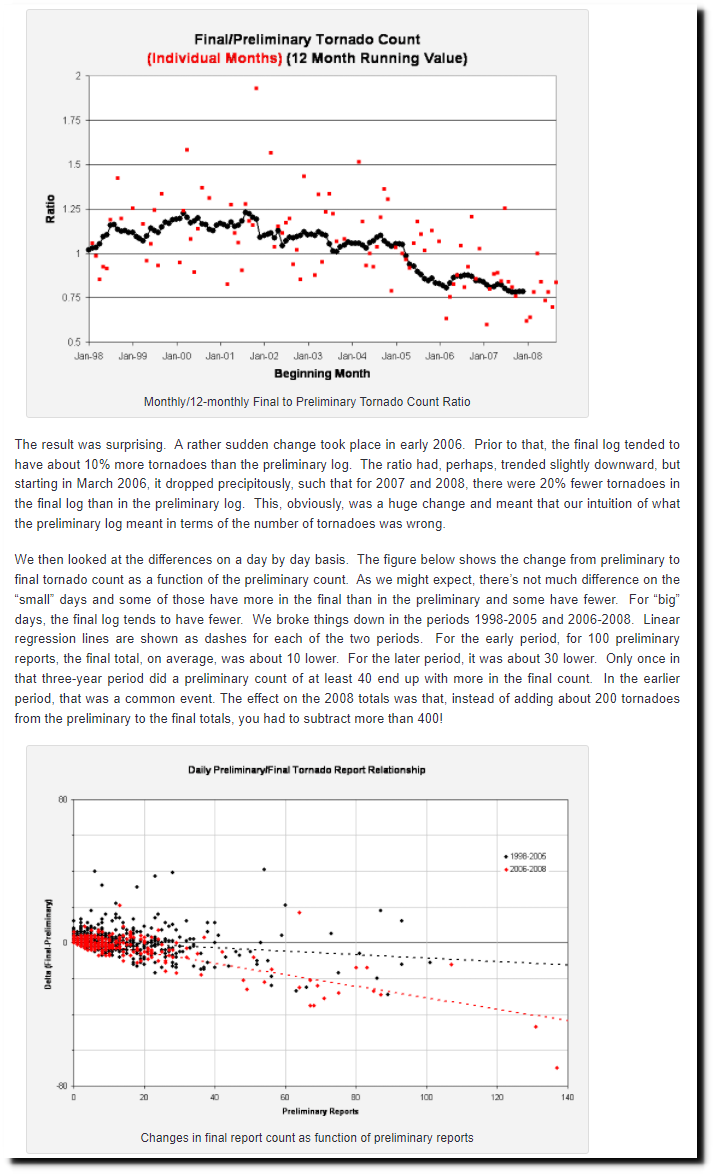
The relationship between preliminary and final tornado reports – NOAA Weather Partners
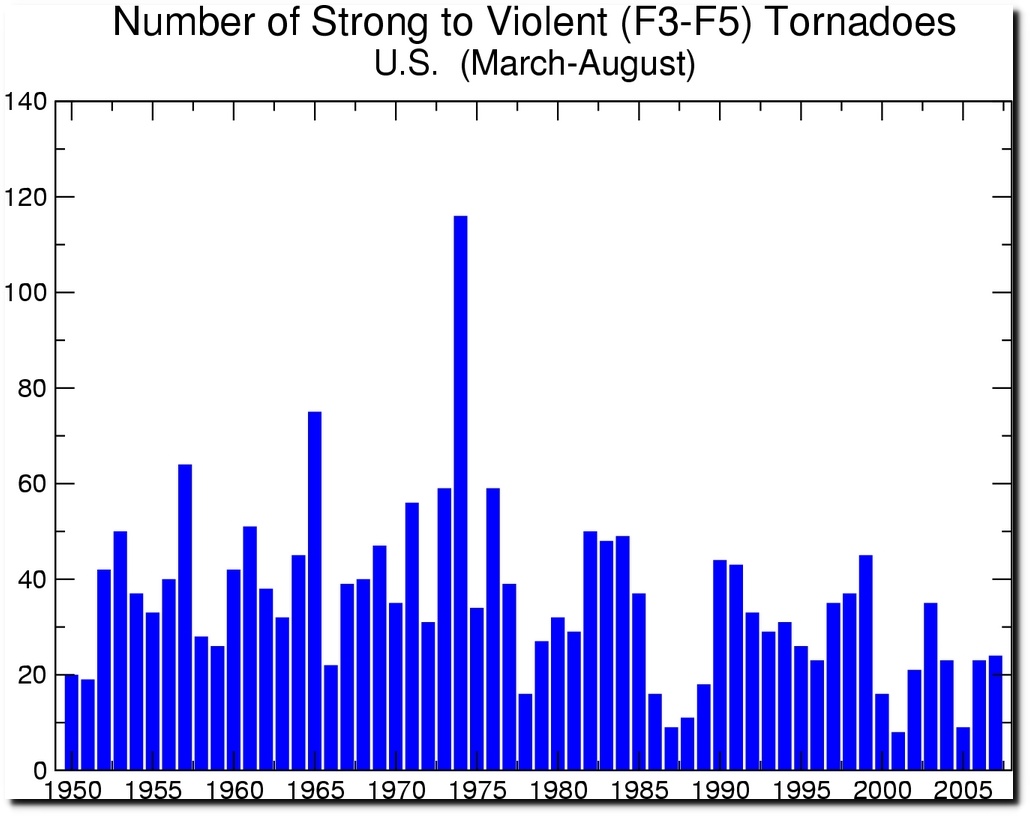
More meaningful data is the number of strong to violent tornadoes, which peaked in 1974 and have been declining for fifty years. It is much less likely that a violent tornado would have been missed in the past. This graph has also been deleted by NOAA.
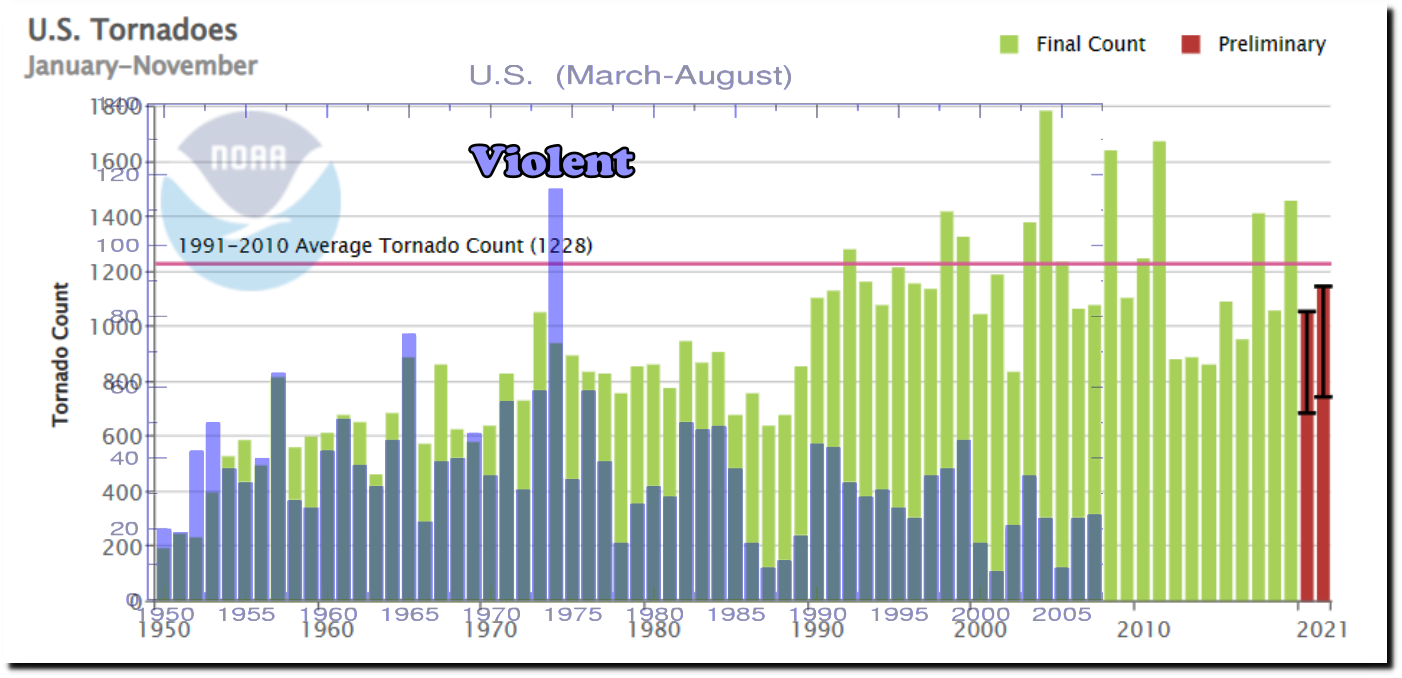
This graph overlays the violent tornados in blue on top of the NOAA all tornado trend, and shows the divergence.
Three years ago was the first year with no violent tornadoes.

2018 will be the first year with no violent tornadoes in the United States – The Washington Post
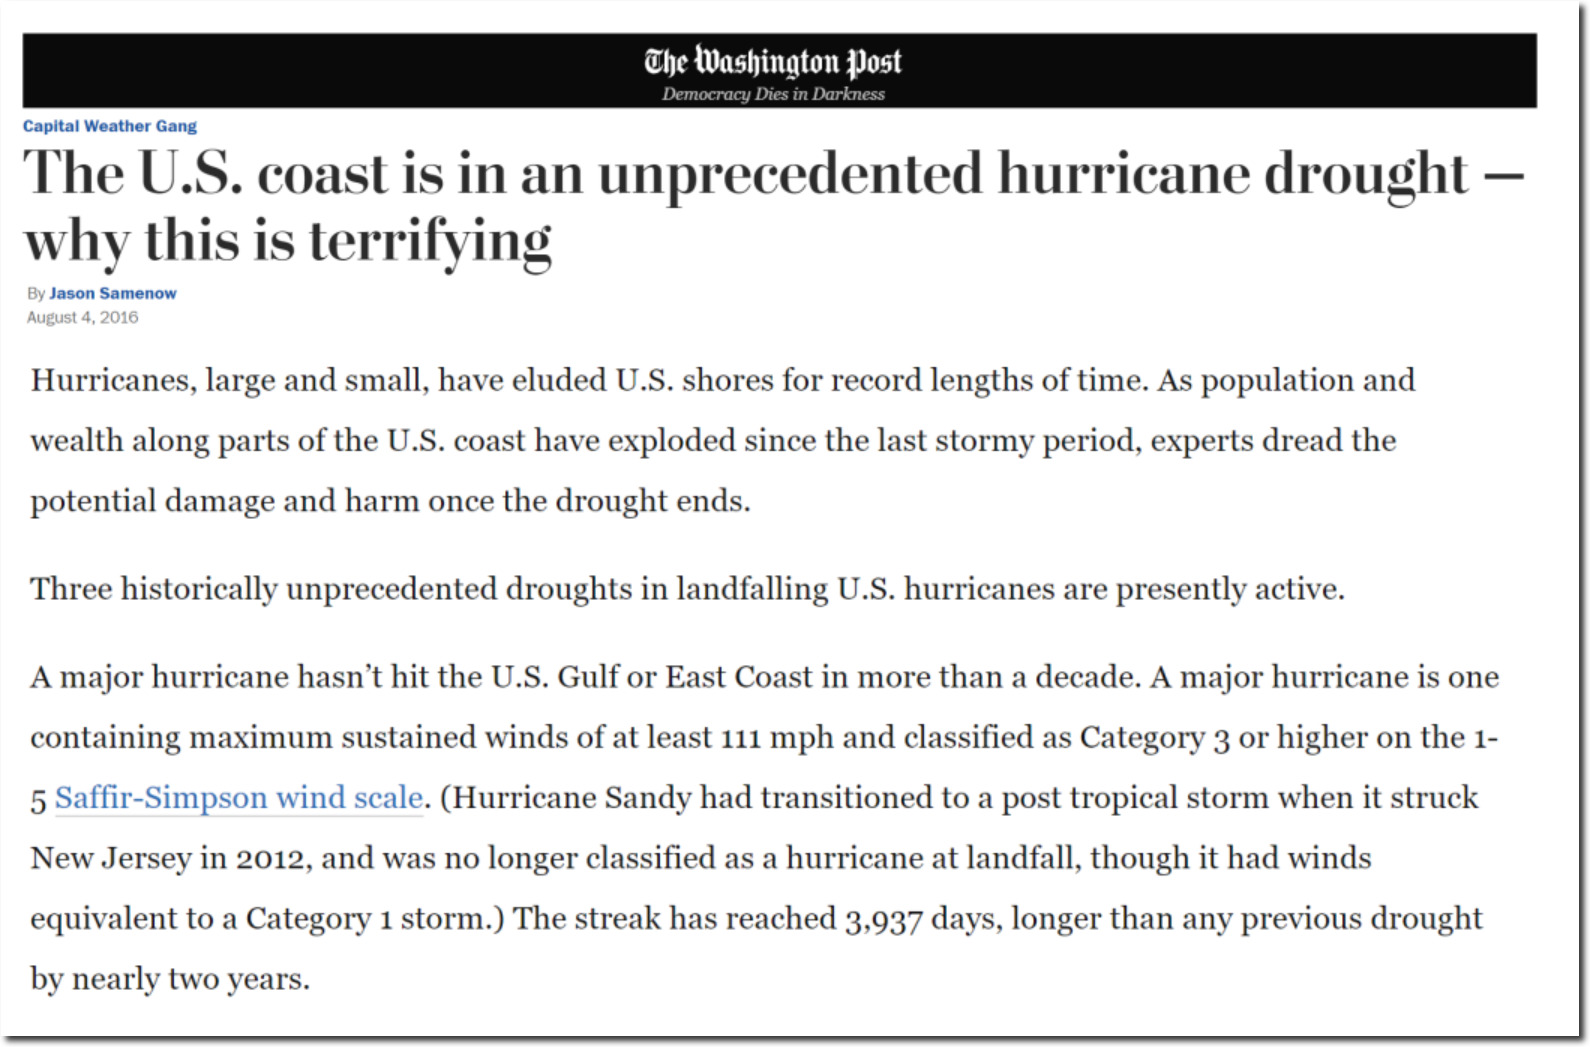
And that followed the most quiet period on record for hurricanes.
